JUGEMテーマ:プログラミング言語 Perl 文法
perlでグラフを作成するサンプルを試してみた。
http://www.gadgety.net/shin/tips/unix/perl-gd.html
ここのページに色々書いてあるので参考にする。
準備
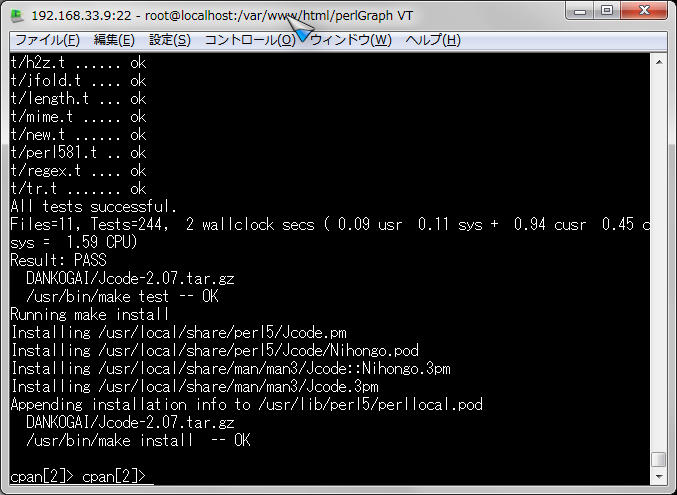
Jcodeをインストール
GDをインストール
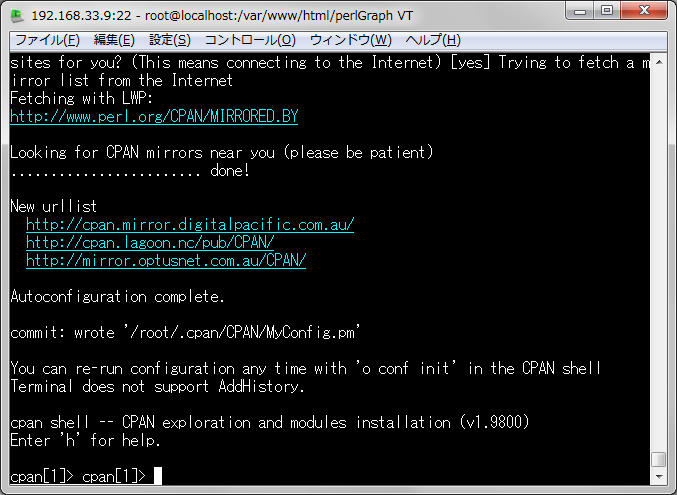
perl -MCPAN -e shell
install Jcode
install GD
yum install gd-devel
perl -MCPAN -e 'install GD::Graph'
実行
ネットから拾ったサンプル
graph.cgi
1 #!/usr/bin/perl -w
2 use strict;
3 use Jcode;
4 use GD::Graph::bars;
5 my @labels = qw( under 10s 20s 30s 40s 50s 60s 70s over );
6 my @dataset = qw( 20 40 60 80 65 15 10 20 5 );
7 my @data = ( ¥@labels, ¥@dataset);
8 my $graph = GD::Graph::bars->new( 400, 300 );
9 $graph->set( title => jcode("にこにこ村の人口")->utf8,
10 y_label => jcode("人数")->utf8 );
11 GD::Text->font_path( "./" );
12 $graph->set_title_font( "GOTHIC_FONT", 14 );
13 $graph->set_legend_font( "GOTHIC_FONT", 8 );
14 $graph->set_x_axis_font( "GOTHIC_FONT", 8 );
15 $graph->set_x_label_font( "GOTHIC_FONT", 10 );
16 $graph->set_y_axis_font( "GOTHIC_FONT", 8 );
17 $graph->set_y_label_font( "GOTHIC_FONT", 8 );
18
19 my $image = $graph->plot( ¥@data );
20
21 open( OUT, "> graph.jpg") or die( "Cannot open file: graph.jpg" );
22 binmode OUT;
23 print OUT $image->jpeg();
24 close OUT;
25
26
perl graph.cgi
ls -al
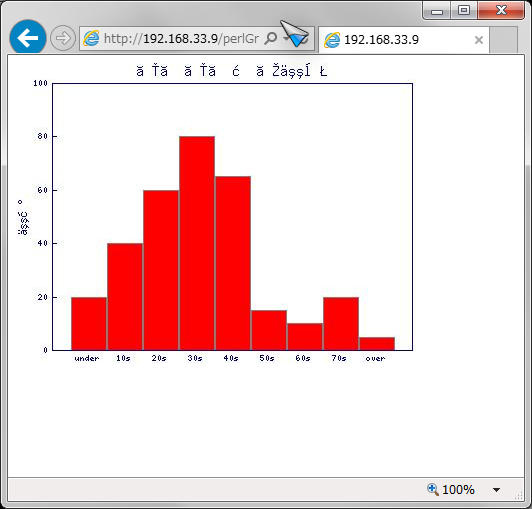
graph.jpgが出来た。
[root@localhost perlGraph]# ls -l
合計 16
-rw-r--r-- 1 root root 854 3月 18 14:21 graph.cgi
-rw-r--r-- 1 root root 11239 3月 18 14:28 graph.jpg
日本語が文字化けするぞ。
フォントダウンロード
wget "https://ja.osdn.net/frs/redir.php?m=jaist&f=%2Fvlgothic%2F62375%2FVLGothic-20141206.zip"
ファイル名が長いので
mv *.zip font.zip
解凍
unzip font.zip
lsで見ると
VLGothicというフォルダがあり
その中に
VL-Gothic-Regular.ttf
と
VL-PGothic-Regular.ttf
が有ったので
cp VLGothic/VL-Gothic-Regular.ttf GOTHIC_FONT.ttf
再度実行
perl graph.cgi
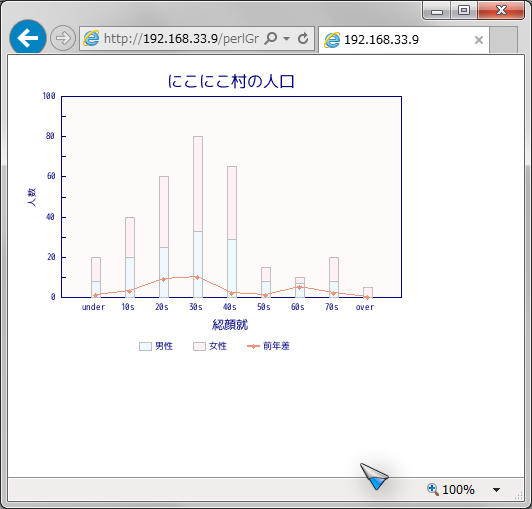
うまく日本語が書けた
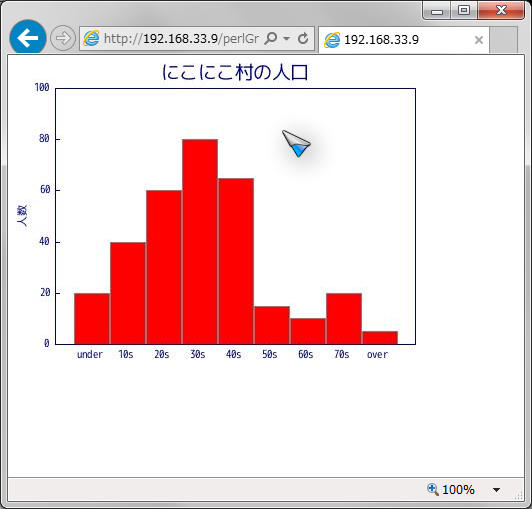
よし。
次は折れ線グラフ
graph.cgi
1 #!/usr/bin/perl -w
2 use strict;
3
4 use GD::Graph::mixed;
5 use GD::Graph::colour qw( :files );
6 use GD::Text;
7 use Jcode;
8
9 GD::Graph::colour::read_rgb( "/usr/lib/X11/rgb.txt" ) or
10 die( "Can't read colours" );
11
12 my @labels = qw( under 10s 20s 30s 40s 50s 60s 70s over );
13 my @male = qw( 8 20 25 33 29 8 7 8 0 );
14 my @female = qw( 12 20 35 47 36 7 3 12 5 );
15 my @differ = qw( 1 3 9 10 2 1 5 2 0 );
16 my @data = ( ¥@labels, ¥@male, ¥@female, ¥@differ);
17
18 my $graph = GD::Graph::mixed->new( 400, 300 );
19
20 $graph->set( title => jcode("にこにこ村の人口")->utf8,
21 t_margin => 10,
22 b_margin => 10,
23 l_margin => 10,
24 r_margin => 10,
25 x_label => jcode("年齢")->utf8,
26 x_label_position => 0.5,
27 y_label => jcode("人数")->utf8,
28 types => [ qw(bars bars linespoints) ],
29 dclrs => [ qw(AliceBlue LavenderBlush DarkSalmon) ],
30 boxclr => "snow",
31 y_tick_number => 10,
32 y_label_skip => 2,
33 line_width => 1,
34 markers => [ 7 ],
35 marker_size => 2,
36 bar_width => 10,
37 bar_spacing => 3,
38 cumulate => 1
39 );
40
41 $graph->set_legend( jcode("男性")->utf8,
42 jcode("女性")->utf8,
43 jcode("前年差")->utf8);
44
45 GD::Text->font_path( "./" );
46 $graph->set_title_font( "GOTHIC_FONT", 12 );
47 $graph->set_legend_font( "GOTHIC_FONT", 7 );
48 $graph->set_x_axis_font( "GOTHIC_FONT", 7 );
49 $graph->set_x_label_font( "GOTHIC_FONT", 9 );
50 $graph->set_y_axis_font( "GOTHIC_FONT", 7 );
51 $graph->set_y_label_font( "GOTHIC_FONT", 7 );
52
53 my $image = $graph->plot( ¥@data ) or die( "Cannot create image" );
54
55 open( OUT, "> graph2.png") or die( "Cannot open file: graph2.png" );
56 binmode OUT;
57 print OUT $image->png();
58 close OUT;
9行目エラーになる。
私の環境では/usr/lib/X11/の中身はからっぽです。
なので、findした。
find / -name rgb.txt
見つかる。
cp /root/.cpan/build/GDGraph-1.54-iqDdqm/samples/rgb.txt /usr/lib/X11/rgb.txt
また実行。
今度は29行目でエラーになる。
rgb.txtの中身と合っていないのか?と思ったので以下のようにあわせて変更
dclrs => [ qw(aliceblue lavenderblush darksalmon) ],
また実行。
エラーが出なかった。
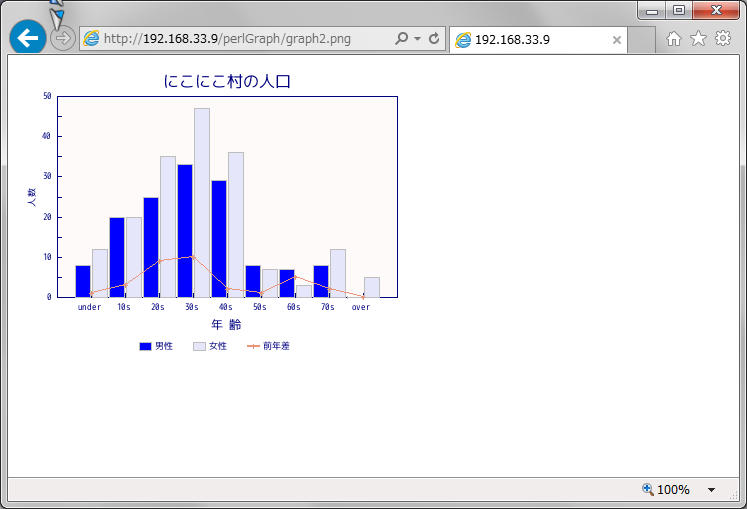
graph2.pngが出来ているので見てみる。
できた。
棒グラフ部分を積算しない場合は
30 $graph->set( title => jcode("にこにこ村の人口")->utf8,
31 t_margin => 10,
32 b_margin => 10,
33 l_margin => 10,
34 r_margin => 10,
35 x_label => jcode("年 齢")->utf8,
36 x_label_position => 0.5,
37 y_label => jcode("人数")->utf8,
38 types => [ qw(bars bars linespoints) ],
39 # types => [ qw(linespoints linespoints linespoints) ],
40 # dclrs => [ qw(AliceBlue LavenderBlush DarkSalmon) ],
41 dclrs => [ qw(blue lavender darksalmon) ],
42 boxclr => "snow",
43 y_tick_number => 10,
44 y_label_skip => 2,
45 line_width => 1,
46 # markers => [ 7 ],
47 # markers => [ 6, 7, 8 ],
48 marker_size => 2,
49 bar_width => 10,
50 bar_spacing => 3,
51 cumulate => 0
52 );
※ポイントは「cumulate => 0」部分です。
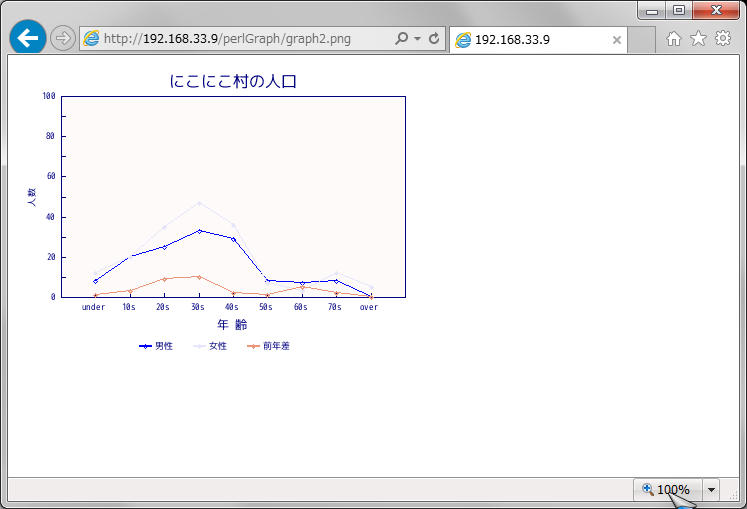
全部折れ線グラフにする場合はこうすると良し
20 $graph->set( title => jcode("にこにこ村の人口")->utf8,
21 t_margin => 10,
22 b_margin => 10,
23 l_margin => 10,
24 r_margin => 10,
25 x_label => jcode("年 齢")->utf8,
26 x_label_position => 0.5,
27 y_label => jcode("人数")->utf8,
28 # types => [ qw(bars bars linespoints) ],
29 types => [ qw(linespoints linespoints linespoints) ],
30 # dclrs => [ qw(AliceBlue LavenderBlush DarkSalmon) ],
31 dclrs => [ qw(blue lavender darksalmon) ],
32 boxclr => "snow",
33 y_tick_number => 10,
34 y_label_skip => 2,
35 line_width => 1,
36 # markers => [ 7 ],
37 markers => [ 6, 7, 8 ],
38 marker_size => 2,
39 bar_width => 10,
40 bar_spacing => 3,
41 cumulate => 1
42 );
線にすると色が薄くて見えないので色は少し濃い色に変更!!
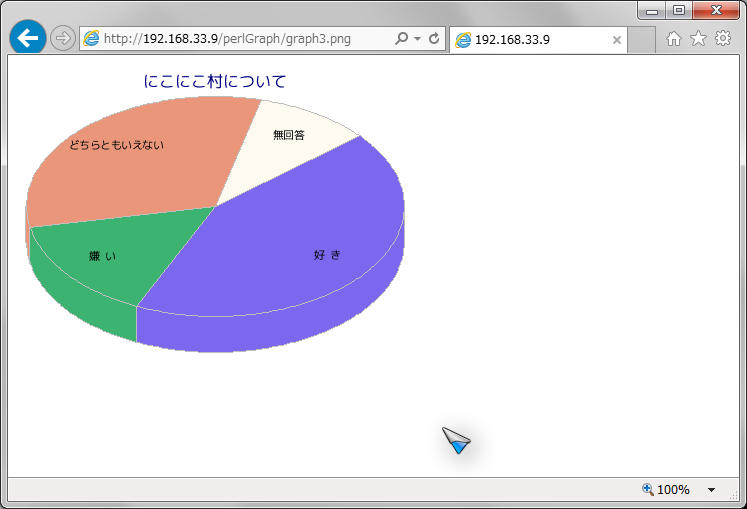
円グラフ
graph3.cgi
1 #!/usr/bin/perl -w
2 use strict;
3
4 use GD::Graph::pie;
5 use GD::Graph::colour qw( :files );
6 use GD::Text;
7 use Jcode;
8
9 GD::Graph::colour::read_rgb( "/usr/lib/X11/rgb.txt" ) or
10 die( "Can't read colours" );
11
12 my @data = ( [ jcode("好 き")->utf8, jcode("嫌 い")->utf8,
13 jcode("どちらともいえない")->utf8, jcode("無回答")->utf8 ],
14 [ 43, 15, 32, 10 ] );
15
16 my $graph = GD::Graph::pie->new( 400, 300 );
17
18 $graph->set( title => jcode("にこにこ村について")->utf8,
19 t_margin => 10,
20 b_margin => 10,
21 l_margin => 10,
22 r_margin => 10,
23 axislabelclr => 'black',
24 dclrs => [ qw(mediumslateblue mediumseagreen darksalmon floralwhite) ],
25 pie_height => 36,
26 start_angle => 230,
27 transparent => 0,
28 );
29
30 GD::Text->font_path( "./" );
31 $graph->set_title_font( "GOTHIC_FONT", 12 );
32 $graph->set_value_font( "GOTHIC_FONT", 8 );
33
34 my $image = $graph->plot( ¥@data ) or die( "Cannot create image" );
35
36 open( OUT, "> graph3.png") or die( "Cannot open file: graph3.png" );
37 binmode OUT;
38 print OUT $image->png();
39 close OUT;
グラフの設定一覧
title グラフのタイトル
t_margin Top マージン
b_margin Bottom マージン
l_margin Left マージン
r_margin Right マージン
x_label X軸ラベル
y_label Y軸ラベル
y_max_value Y軸の最大値
y_tick_number Y軸を刻む数
y_label_skip Y軸ラベルのスキップ
types mixed タイプのグラフの場合、各データをどの種類のグラフにするか無名配列でリストする
cumulate データセットが積算される(棒グラフ、面グラフ)
line_types 線グラフの線の種類を無名配列でリストする( 1:実線 2:ダッシ 3:点線 4:点線 )
line_width 線グラフの太さ
markers 点、点付折れ線グラフで使われる点の種類を無名配列でリストする
( 1:塗り四角 2:四角 3:十字 4:クロス十字 5:塗り菱形 6:菱形 7:塗り丸 8:丸 )
marker_size 点、点付折れ線グラフで使われる点のサイズ(デフォルト 4)
bar_width 棒グラフの幅
bar_spacing 棒グラフ間の幅
bgclr グラフの背景色
fgclr グラフの前景色
boxclr グラフ内の背景色
dclrs グラフの色を無名配列でリストする
accentclr グラフの外枠の色
shadowclr グラフの影の色
shadow_depth グラフの影の幅
また、よく使いそうなメソッドもリストしておきます。
set_legend() 凡例となる文字列をリストする
set_text_clr() 文字の色
ちなみに、12行目と13~22行目は同じ意味です。
実際にDBからデータ持ってきて表示する場合は13行目~方法だよね。
12 #my @labels = qw( under 10s 20s 30s 40s 50s 60s 70s over );
13 my @labels;
14 $labels[0] = "under";
15 $labels[1] = "10s";
16 $labels[2] = "20s";
17 $labels[3] = "30s";
18 $labels[4] = "40s";
19 $labels[5] = "50s";
20 $labels[6] = "60s";
21 $labels[7] = "70s";
22 $labels[8] = "over";