Kaneko MK, Suzuki H, Ohishi T, Nakamura T, Tanaka T, Kato Y.
A Cancer-specific Monoclonal Antibody against HER2 Exerts Antitumor Activities in Human Breast Cancer Xenograft Models
Int. J. Mol. Sci., 25(3), 1941; https://doi.org/10.3390/ijms25031941, 2024 (PDF)
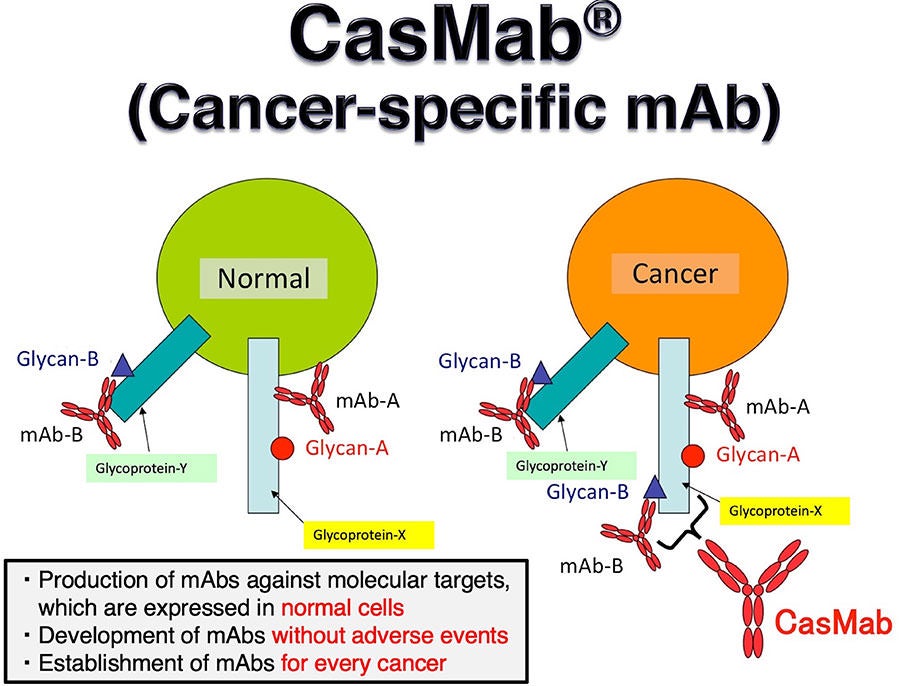
Abstract: Monoclonal antibody (mAb)-based and/or cell-based immunotherapies provide innovative approaches to cancer treatments. However, safety concerns over targeting normal cells expressing reactive antigens still exist. Therefore, the development of cancer-specific mAbs (CasMabs) that recognize cancer-specific antigens with in vivo antitumor efficacy is required to minimize the adverse effects. We previously screened anti-human epidermal growth factor receptor 2 (HER2) mAbs and successfully established a cancer-specific anti-HER2 mAb, H2Mab-250/H2CasMab-2 (IgG1, kappa). In this study, we showed that H2Mab-250 reacted with HER2-positive breast cancer cells, but did not show the reactivity to normal epithelial cells in flow cytometry. In contrast, a clinically approved anti-HER2 mAb, trastuzumab recognizes both breast cancer and normal epithelial cells. We further compared the affinity, effector activation, and antitumor effect of H2Mab-250 with trastuzumab. Results showed that H2Mab-250 exerted a comparable antitumor effect with trastuzumab in the mouse xenograft models of BT-474 and SK-BR-3 although H2Mab-250 possesses a lower affinity and effector activation than trastuzumab in vitro. H2Mab-250 could contribute to the development of chimeric antigen receptor-T or antibody-drug conjugates without adverse effects for breast cancer therapy.

Figure 1. Flow cytometry using anti-HER2 mAbs against HER2-overexpressed cells, breast cancer cell lines, and normal epithelial cell lines. (A) Flow cytometry using H2Mab-250-mG2a (10 μg/mL; Red line) and tras-mG2a (10 μg/mL; Red line) against CHO-K1, CHO/HER2, HER2-positive breast cancers (BT-474 and SK-BR-3), a triple-negative breast cancer (MDA-MB-468), and spontaneously immortalized normal epithelial cells (HaCaT and MCF 10A), immortalized normal epithelial cells including HBEC3-KT (lung bronchus), hTERT-HME1 (mammary gland), hTCEpi (corneal), hTEC/SVTERT24-B (thymus), RPTEC/TERT1 (kidney proximal tubule), and HCEC-1CT (colon). (B) Flow cytometry using H2Mab-250-hG1 (10 μg/mL; Red line) and trastuzumab (10 μg/mL; Red line) against the abovementioned cell lines. The cells were treated with Alexa Fluor 488-conjugated anti-mouse IgG or fluorescein (FITC)-conjugated anti-human IgG. The fluorescence data was collected using SA3800 Cell Analyzer (Sony Corp., Tokyo, Japan), and the data were analyzed using FlowJo v10.8.1. The black line represents the negative control (blocking buffer).

Figure 2. Binding affinity of H2Mab-250-mG2a, H2Mab-250-hG1, tras-mG2a, and trastuzumab to HER2ec. (A–D) HER2ec was immobilized on immunoplates, and then incubated with the serially diluted H2Mab-250-mG2a (A), tras-mG2a (B), H2Mab-250-hG1 (C), and trastuzumab (D), followed by peroxidase-conjugated anti-mouse or anti-human immunoglobulins (n = 3). Enzymatic reactions were conducted and the optical density at 655 nm was measured. Values are presented as the mean ± SD. The binding isotherms were fitted into the built-in, one-site binding model in GraphPad PRISM 6 to calculate the binding affinity.

Figure 3. The ADCC reporter assay by H2Mab-250-mG2a, H2Mab-250-hG1, tras-mG2a, and trastuzumab in the presence of BT-474 and SK-BR-3 cells. Target HER2-positive breast cancer cells such as BT-474 (A) or SK-BR-3 (B) were cultured in a 96-well white solid plate. H2Mab-250-mG2a, H2Mab-250-hG1, tras-mG2a, and trastuzumab were serially diluted and added to the target cells (n = 3). The engineered Jurkat cells were then added and co-cultured with antibody-treated target cells. Luminescence using the Bio-Glo Luciferase Assay System was measured using a GloMax luminometer (Promega Corporation, Madison, WI, USA). Values are presented as the mean ± SD. The EC50 was calculated using GraphPad PRISM 6.

Figure 4. Immunohistochemical analysis of H2Mab-250 and tras-mG2a in a breast cancer tissue section and normal tissues. (A) A HER2-positive breast cancer tissue sections were treated with H2Mab-250 (10, 1, and 0.5 µg/mL) or tras-mG2a (10 µg/mL). (B) Sections of normal HER2-positive breast cancer, normal breast, and heart were treated with H2Mab-250 (0.1 µg/mL). The sections were then treated with the Envision+ kit (Agilent Technologies, Inc., Santa Clara, CA, USA). The chromogenic reaction was performed using DAB, and the sections were counterstained with hematoxylin. Scale bar = 100 µm.

Figure 5. Antitumor activity of H2Mab-250-mG2a and tras-mG2a against BT-474 and SK-BR-3 xenografts. (A,B) BT-474 (A) and SK-BR-3 (B) cells were injected into BALB/c nude mice (day 0). On day 6, 100 μg of tras-mG2a (n = 8), H2Mab-250-mG2a (n = 8), or a control mAb (PMab-231) (n = 8) were injected into mice. On days 13 and 20, additional antibodies were injected. On days 6, 13, 20, and 27, the tumor volume was measured. Values are presented as the mean ± SEM. ** p < 0.01 (two-way ANOVA and Tukey’s multiple comparisons test). (C,D) The tumor weight of BT-474 (C) and SK-BR-3 (D) xenograft tumors on day 27. Values are presented as the mean ± SEM. ** p < 0.01 (ANOVA and Tukey’s multiple comparisons test). (E,F) The BT-474 (E) and SK-BR-3 (F) xenograft tumors on day 27 (scale bar, 1 cm). (G,H) The body weight of BT-474 (G) and SK-BR-3 (H) xenograft-bearing mice treated with control mAb (PMab-231), tras-mG2a, and H2Mab-250-mG2a. * p < 0.05 (two-way ANOVA and Tukey’s multiple comparisons test).

Figure 6. Antitumor activity of H2Mab-250-hG1 and trastuzumab against BT-474 and SK-BR-3 xenografts. (A,B) BT-474 (A) and SK-BR-3 (B) cells were injected into BALB/c nude mice (day 0). On day 7, 100 μg of H2Mab-250-hG1 (n = 8), trastuzumab (n = 8), or a control human IgG (hIgG) (n = 8) were injected into mice. On days 14 and 21, additional antibodies were injected. Human NK cells were injected around the tumors on the same days of Ab administration. On days 7, 14, 21, and 28, the tumor volume was measured. Values are presented as the mean ± SEM. * p < 0.05, ** p < 0.01 (two-way ANOVA and Tukey’s multiple comparisons test). (C,D) The tumor weight of BT-474 (C) and SK-BR-3 (D) xenograft tumors on day 28. Values are presented as the mean ± SEM. ** p < 0.01 (ANOVA and Tukey’s multiple comparisons test). (E,F) The BT-474 (E) and SK-BR-3 (F) xenograft tumors on day 28 (scale bar, 1 cm). (G,H) The body weight of BT-474 (G) and SK-BR-3 (H) xenograft-bearing mice treated with trastuzumab, H2Mab-250-hG1, or a control hIgG.
関連プレスリリース