☆フェアウインズのガンダーセン氏に直接会って
お話を伺ってきました☆
の記事パート2です。

それでは...
まず、カルトフェン氏のビデオの内容の
日本語訳から紹介します。
特に重要な所は赤字にしてあります。
(直訳では意味が通じにくい箇所は意訳にしています)
Transcript “ The Hottest Particle”
「超高放射性粒子」
Hi, I am Arnie Gundersen from Fairewinds.
I am here today to introduce professional engineer Marco Kaltofen
in one of the most important videos Fairewinds Energy Education
has ever produced.
こんにちは、フェアウインズのアーニーガンダーセンです。
今日は、プロフェッショナルエンジニア(PE)である
マルコカルトフェン氏によるビデオをご紹介します。
このビデオは今までフェアウインズが発表してきた
数々のビデオの中でも、
非常に重要なものであるといえます。
Three years ago,Fairewinds was one of the first organizations
to talk about the “hot particles” that are scattered all over Japan and North America’s west coast.
Hot particles are dangerous and difficult to detect.
In this video Mr. Kaltofen discusses the hottest hot particle he has ever found,
and it was discovered more than 300 miles from the Fukushima Daiichi site.
If Fairewinds Energy Education was a Japanese website,
the State Secrets Law would likely prevent us from issuing this video.
I will provide a brief summary at the end of the video.
3年前、日本全土と北アメリカ沿岸に
ホットパーティクル(高放射性粒子)が降り注いだのですが、
この事実について語ったのは、
フェアウインズが一番最初の組織でした。
ホットパーティクル(高放射性粒子)は危険で、
探知することが難しい物質です。
このビデオの中で、カルトフェン氏は
なかでも非常に高い放射能を持つ
超高放射性粒子を発見したことついて語っています。
これは福島第一原発から
300マイル(482km)も離れた場所で
見つかりました。
もし私達フェアウインズのウェブサイトが
日本のウェブサイトであったなら、
秘密保護法によって
このビデオがリリースされないように
妨害されることでしょう。
このビデオの最後に簡単なまとめを、
私からお話したいと思います。
※ここからカルトフェン氏のビデオが始まる

I’m Marco Kalton.
I am a civil engineer and I’m a Ph.D candidate at Worcester Polytechnic Institute.
Most of my research looks at radioactive and chemical contaminants and how they wind up in house dust.
And the reason for doing that is this is
a very important way that the general public is exposed to things like radioactive contaminants.
In looking at indoor environments, they tend to be much more contaminated than the surroundings outside.
Houses act like a trap and they tend to collect outdoor contaminants.
And they expose people as much as 24 hours a day versus consider how short a time most people spend outdoors.
Your exposure is actually much less.
私はマルコカルトフェンです。
私はの土木関連の専門技師であり、
現在ウォーセスターポリテクニック研究所にて
博士号の取得過程にあります。
私が主にリサーチしているのは放射能汚染とケミカル汚染について、
またそれらの汚染物質がどのように
家屋の内部に蓄積していくのかについてです。
何故そのようなリサーチをするのかといいますと、
これは一般市民がどのように放射能汚染にさらされて
被爆をするのかを知る為にはとても重要なことだからです。
家屋内の環境に関して言えることは、
建物の内部というものは、外部よりも
汚染の度合いが高くなるという傾向があります。
家屋というものは外部の汚染を集めてしまうのです。
実際は家の外で汚染する被爆量の方が少ないということです。
1日24時間のうち、実際に建物の外にいる時間の方が、
通常は短いものですしね。
One of the nice things about social media is that we can talk to a lot of people
and hook up with volunteers and volunteer and scientific organizations.
And they were able to send us indoor dust samples,
whether it was a vacuum cleaner bag or a sample from a home air filter or something like an appliance filter
– think of an air conditioner filter or a heating and ventilation filter that people might have installed in their home.
And we actually have developed a very straight-forward method for prepping all of these samples.
And that way, we can compare people’s exposure from one house to another.
We looked at samples in Northern Japan;
we looked at samples in Tokyo; we looked at samples in the United States and Canada.
We tried to get a feel for what people’s actual exposure was.
ソーシャルメディア
(ブログやツイッター、フェイスブックやその他の様々な掲示板など)
の素晴らしいところは、
世界中の沢山の人々と話せる機会が得られること、
そして沢山のボランティアの方々や科学者達、またはそういった組織との
繋がりを得られることです。
そしてそうして出会った人達は、
エアフィルター等のサンプルを送ってくれました、
例えば家庭用の電気器具なんかの、そうですね、
彼らの家に設置してあったエアコンやヒーターのフィルターや、
換気扇のフィルター等です。
私達はこれらすべてのサンプルを、非常にシンプルな方法で処理し、
いろんな家の被爆度を比較検証しようとしました。
私達は北日本、東京、アメリカ、
そしてカナダからのサンプルに注目してみました。
実際に人々がそれくらい被爆しているのかを
知ろうとしたのです。
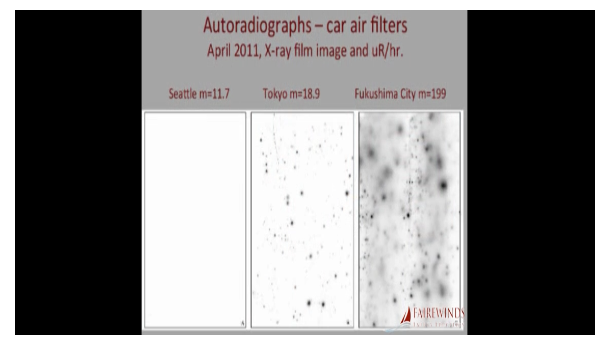
 ※上の写真は2011年4月にシアトルと東京、福島を走っていた車のカーフィルターをX線フィルムに感光させて放射性物質を目に見える形で焼き増ししたもの。
And that’s why we went looking for hot particles. The thing about radiation exposure is, if you look at it from a legal perspective, what you’re trying to do is find the average exposure that people get and then try and find some kind of safe level you can measure that against. And if you exceed that average level that you think is safe, then you have to start doing something about it; either institute some type of policy or some kind of cleanup.The difference with our work is, while we understand there’s an average concentration people get, some people get a much higher or a much lower concentration. And that depends on how many hot particles, how many radioactive dust particles from the original accident can make their way through the air into somebody’s home. And if they’re small enough to be ingested or inhaled, then you have to count that over and above what their average exposure could be. When you look at the two different components of people’s exposure – (1) your average exposure; and (2) your exposure from hot particles, your hot particle exposure is going to be more rare, because there is a comparatively small number of hot particles that are disbursed from a site. So most people won’t be exposed to any. But a few people will be exposed to one or more than one. And that exposure from the hot particle can actually be bigger than the average exposure that everyone is getting. So you have to measure both components if you really want to understand what’s happening to people. So when we get a sample, we actually have a whole series of analyses that we’re doing.
そのために私達はホットパーティクル(高放射性粒子)に着目しました。
放射能汚染に被爆するということを法的視点で考えると、
始めにそのエリアでの平均的な汚染度や被爆度を求め、
それからではこのぐらいなら大丈夫でしょうという、
安全なレベルというものを求めます。
もしもあなたがその安全なレベルと言われている
汚染度を超えて被爆していると考えるなら、
何らかの指針を設けて、対策をとる必要がありますね、
除染するなどして。
私達は被爆の平均値という物について理解すると同時に、
ある一定の人々は平均値よりも多く被爆するだろうし、
またある一定の人達は平均よりも被爆数値が低いだろうと考えます。
この考え方において私達の調査の事例は
他と異なります。
それは、どれくらいの量の放射能汚染された塵が、
原発事故の起きた場所(福島第一原発)から、
どのような経過をたどって
誰かの家に入り込むのかによるのです。
もしもそれらの放射能汚染された塵が、
食べ物と一緒に口の中に入ったり、
呼吸と一緒に肺の中へ吸い込める程に小さなものだったとしたら、
それは内部被爆として、
平均の汚染度や平均の被爆量と言われている数値の
何倍もの被爆をするということになるのです。
被爆数値の構成要素について考えてみましょう。
あなたが住んでる環境からの平均の被爆、
つまり外部被爆
ホットパーティクル(高放射性粒子)を
取り込むことによって被爆する
内部被爆
ホットパーティクル(高放射性粒子)による内部被爆は
そう多くはないといえるでしょう。
原発事故の起きた現場から放出された
ホットパーティクル(高放射性粒子)の数は比較的、
少ないからです。
ですから殆どの人は
このホットパーティクル(高放射性粒子)によって
内部被爆する事はないでしょう。
しかし、少数の人達は一粒か、
もしくは二粒以上のホットパーティクル(高放射性粒子)を
体の内部に取り込み、内部被爆をするでしょう。
このように内部被爆をすると、
外部被爆の平均値よりも被爆数値は高くなります。
ですから今、
実際に人々に何が起きているのかを知るためには、
この外部被爆と内部被爆の両方を考えて計算に入れる必要があります。
私達はサンプルを得た後、
一連の分析を得ることが出来ました。
We do some very basic analyses that give us the average exposure. We use something called gamma spectrometry. Gamma spectrometry has been around for nearly 100 years and we use that to see which isotopes, which radioactive materials are present in the sample.Now with Fukushima, we generally see three isotopes over and over again. And two of them are Cesium 134 and Cesium 137. When we see both of them in a certain ratio we can be fairly certain we’re looking at a material that’s contaminated with material from the Fukushima accident. Now that’s a fission product and that only comes after there’s been some kind of nuclear reaction. The other thing we’re looking at is Radium 226. And that’s actually related to the original uranium fuel that starts the nuclear process in the first place. So those three things are what we’re looking for when we’re doing our test for dust sample. And if we find them, then we go on to part 2 and try and identify if hot particles are present.
私達はまず基本的な分析をし、
平均の外部被爆の数値を算出しました。
私達はガンマスペクトロメトリーと呼ばれるものを使用しました。
このガンマスペクトロメトリーという物は、
過去100年以上に渡って使用されている技術であり、
どんな核種が、どんな放射性物質が
サンプルの中に存在しているのかを検査するものです。
福島からの放射能汚染の中に見られる
3種類の核種<があります。
まずは、セシウム134とセシウム137です。
この2つの核種の割合をみることによって、
私達はこの汚染が福島からの物であることを
かなり確実に特定することができます。
またこれらの核種は、
核分裂により生成物であり、
なんらかの核反応の後に生成される物質です。
3種類の核種のうちのもう一つがラジウム226です。
これはもともとのウラン燃料が
核分裂反応のプロセスを始める最初の段階で
生成されます。
もしこれらを見つけたら、
私達は第二段階、ホットパーティクルが
その中に存在しているかどうかを
鑑定する作業に進みます。
The way that happens is, once we’ve ID’d a sample that we want to take to the next level where we want to do the hot particle analysis, we actually sieve out some of the finer particles, and we spread them on a copper plate and we exposure them to X-ray film. We expose them for a week. Now this is another old technique. It’s probably more than a century old. But what happens is, it identifies the places in the dust sample where there might be a small, radioactively hot particle. We can actually develop that X-ray plate and if there’s a positive result from location, we just take an Exacto knife, we remove it, we put it onto an aluminum microscope slide, and it’s analyzed by a scanning electron microscope. Not just any old microscope, but one that can give us an actual elemental analysis as we’re going along. So imagine you’re looking through the microscope. It’s all done on video these days. And you can actually see all the individual particles magnified maybe as much as 5,000, 10,000, 15,000X. And as you’re scanning, you’ve got a joystick and a set of crosshairs. Think of a videogame. And you can zap each particle one at a time with an X-ray beam and you can actually weed out which elements are present. And when you’re starting to see the radioactive elements – plutonium, Americium, uranium, radium, then you know you’re getting somewhere. So we can actually, through this process, take a sample that might weigh a pound or two pounds – a half a kilo, a full kilo, and isolate as few as one or two hot particles from that entire sample.
どういう風にするのかというと、
ホットパーティクルの分析を行うという
第二段階へ進める為に鑑定したサンプルをふるいにかけ、
よりさらに細かい粒子に分け、
銅製のプレートの上に薄く伸ばし、
それをX線用のフィルムに感光させるのです。
1週間、感光させておきます。
これはまた別の古くから行われているテクニックです。
おそらく一世紀以上前から。
サンプルの塵の中から、どこに小さな放射性の,
ホットパーティクルがあるのかを見極めることができます。
その感光させたX線用フィルムを焼き増しすることもできます。
そしてもし可能性のある箇所が見つかったら、
その部分だけをイグザクトナイフ* で切り取ります。
それをアルミニウム製の顕微鏡用スライドの上にのせ、
電子顕微鏡でさらに細かく調べます。
※イグザクトナイフ* 細かいところを切り抜く為のカッター
普通の顕微鏡ではなく、
見ながら元素の分析をすることが可能な
特別な電子顕微鏡を使います。
では実際にこの電子顕微鏡で
見ているイメージをしてみましょう。
スクリーンで実際に映像として見ることができるのです。
ひとつひとつの粒子を
五千倍、一万倍、一万5千倍に拡大して
見ることができます。
これを見ながら顕微鏡の操作レバーを操り、
粒子のひとつに焦点を合わせるのです。
ビデオゲームのようなものです。
粒子のひとつひとつにX線ビームを当てて、
その元素の構成についての分析処理をしていくのです。
そうしていくうちに、
放射性の粒子を見つけるのです。
それらはプルトニウムであったり、
ウラニウム、ラジウムだったりします。
分析に使用するサンプルは0.5キロか1キロ分程の塵なのですが、
この塵の粒子の中から、このようなプロセスを経て、
一粒か、二粒程のホットパーティクル(高放射性粒子)を見つけて
取り出す作業になります。
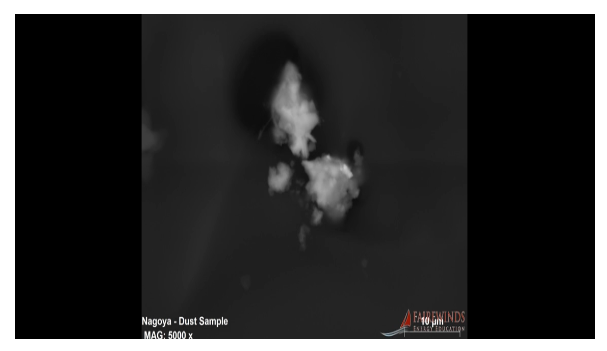
 ※名古屋の一般家庭の掃除機ゴミパック内の塵から見つかったホットパーティクル(高放射性粒子)
And then do a full analysis and a breakdown. And that’s extremely valuable to us. It tells us a lot about what might happen if someone inhaled or ingested that particle.All hot particles are not alike. Some are modestly elevated. They’re a little bit more radioactive than their surroundings. These are awfully hard to detect. But others tend to be orders of magnitude, factors of 10 more contaminated than their surroundings. Think the Richter scale where an earthquake magnitude 5 is 100 times more powerful than an earthquake magnitude 3. That’s what we’re looking for with hot particles, not things that are just a little bit more radioactive, but much more.We get those – those highly radioactive particles – even though they’re small, they can give us a lot of information about where they came from because we can actually see it in the microscope. We can see how big it is, we can see what shape it is. It really gives a history of what happened to the particle. And it gives a fingerprint of where that particle came from. And the last step, if we know how big it is and we know its elemental composition and how radioactive it is, we can actually tell exactly how dangerous that particle will be if you happen to inhale it or if you happen to ingest it.
そして更に細かい分析を行います。
これは非常に意味のある大切な作業です。
なぜかというと、もしこの小さな粒子を
誰かが呼吸として吸いこんだり、
または食べ物に混入して体内に入ってしまった場合に、
何が起こるかが分かるからです。
すべてのホットパーティクルは似ておらず、
それぞれ違っています。
幾つかの放射性粒子は、
他の放射性粒子よりもやや高い放射能を持っています。
それらを見つけ出すのは非常に難しいです。
また別のある粒子は、
ちょうど*マグニチュードと地震エネルギーの対数関係のように、
10の指数倍で表さなければならない程の
強烈な放射能を持っています。
補足*マグニチュードは地震のエネルギーと対数関係にあり、
マグニチュードが2増えるとエネルギーは1000倍になる。
つまり一般的な放射性粒子と比べて、
高放射性粒子であるホットパーティクルは
2倍とか3倍汚染度が強いというレベルの話ではなく、
とてつもなく放射性が高いという意味。
リクタースケール
(マグニチュードと地震エネルギーの対数関係を表すグラフ)
について考えてみると、
マグニチュード5というのは、マグニチュード3よりも
100倍も強い地震エネルギーを持っています。
私達が探している
ホットパーティクル(高放射性粒子)と言う物は
つまりそういうもであって、
一般の放射性粒子よりも、ちょっとだけ放射性が高いとか、
そういうレベルの話ではないんです。
とてつもなく高いのです。
私達はそれらを見つけたのです、
そのとてつもなく高い放射能を持った粒子を。
とても小さな粒子ですが、
何処から来たものなのか、私達に教えてくれます、
なぜなら(先ほど話した特別な)
電子顕微鏡で見ることができるからです。
どれくらいの大きさなのか、
どんな形をしているのかを見ることができます。
この粒子がどのような経過を辿ってきたのか、
またはその証拠を知ることができるのです。
そして最終ステップとしては、
もしこの粒子のサイズ、原子構成、放射能の強さ等を
知ることができれば、
この粒子を吸い込んだり、経口摂取すれば
どうなるかも知ることができます。
You can say, well, we don’t know what might happen to a particular person, we just know what the average is. Well, that’s true of non-hot particle testing. But with this, we can take a hot particle and say, all right, the person in this household, if that person had inhaled this particular particle, their odds would be 7 percent or 70 percent of contracting a lung cancer or an epithelial tissue cancer or a nasal pharyngeal cancer.You can actually see which one of these is more likely once you have the photograph of the particle. So it’s a time consuming analysis but it tells us a lot about what the potential hazards are.
「実際にはどの人に何が起こるかなんて分からないじゃないか、
私達にはただ(健康障害が起こる)確立の平均値しか分からないだろう。」
そうあなたは思いますか。
そうですね、一般的な放射性粒子に関しては
おそらくそうでしょう。
でもこホットパーティクル(高放射性粒子)に関しては、
7%の人が肺癌になるとか、
あるいは70%の人が皮膚癌になるとか、
喉頭癌になる可能性があるだろうというふうに
はっきり言うことができます。
そういった粒子たちの画像を実際に見ることができます。
とても時間のかかる分析ですが、
どのような健康被害が起こるかその危険性について
多くの事を知ることができます。
 ※肺に取り込まれたホットパーティクル(放射性物質を含んだ埃)が周囲の細胞を破壊している様子。
And it’s a good way to diagnose which areas are going to have which times of potential health damages.The sample that we got came from the Goya in Japan. It’s 460 kilometers from the accident site. That’s about 300 miles away. The hot particle was 10 microns across. That means it is 10 one-millionth of a meter across; obviously, something you’re only going to see with a powerful microscope. The particle was actually in the size range of dusts that can be inhaled and then retained in the lungs.And this is important because if you’re a health physicist and you’re calculating the dose that you would get from this particle, you’d have to consider that this particle might actually be trapped and result in a lifetime exposure.Thing of asbestos workers who inhaled an asbestos particle and when they eventually died, from whatever reason, that asbestos particle is still in their lungs. Well, this kind of hot particle would probably do something very, very similar.The particle that we examined was a mixture of fission products from a nuclear reactor and nuclear fuels. We looked at materials like Telurium, Radium 226.We saw Cesium 134 and 137, Cobalt 60 and a whole zoo of isotopes that probably you’ll never hear about on CNN but you’d have to be a physicist to understand. Let’s put it this way.
どの地域で、
何倍の健康被害があるかについてを知る
良い方法です。
私達の得たサンプルは日本の名古屋からの物でした。
460キロメートル福島の第一原発から離れたところです。
約300マイルです。
ホットパーティクル(高放射性粒子)は
10マイクロ幅でした。
0.00005mの大きさということです。
当然のごとく、とても高い性能を持った顕微鏡でしか
見ることができません。
呼吸として容易に吸い込める大きさであり、
また肺の中にとどまることもできるサイズです。
これはとても重要なことなのです、
何故なら、もしあなたが保健物理学者なら、
このホットパーティクルからの被爆量の計算をし、
この粒子は障害体内に残り、
被爆し続けるものとして考察する必要があるからです。
アスベストを取り扱った為に、
アスベストの粒子を吸引した労働者が亡くなったとします。
死因はさておいて、
アスベストの粒子はそれでもまた彼らの体内に残っています。
ホットパーティクル(高放射性粒子)にも
ほぼ同じことが言えます。
私達が調査した粒子は原子炉の中で
核分裂したことによって出た物質と
核燃料そのものの混ざり合ったものでした。
テルルとラジウム226です。
またセシウム134と137、コバルト60、
その他にも、めったにCNN(アメリカのニュース番組)の放送でも聞かないような、
物理学しか知らないような、
そんな名前の核種の数々を見ました。

Eighty percent by weight of this particle was made up of pure reactor core materials. So that tells me that something that came directly from the accident, directly from the core, could escape containment and travel a very, very significant distance.So it’s a long distance to travel, and what happens is the particle is so very small that it will essentially travel with whatever gas it’s entrained in. The winds will blow it long distances.What’s going to happen is the further you get away from the reactor, the less likely you are to find a hot particle of this magnitude. But of course we’ve looked at so many samples from Japan, this just happens to be the longest distance and the hottest particle that we’ve found. I have to put some numbers on it.
この粒子の重量の80%は、
原子炉の炉心の物質です。
この粒子は事故のあった原子炉の炉心から
とても長い距離を旅してやってきたのです。
とても長い距離の移動です、
この粒子はとても小さいので、
気体となって風に乗ると、
とても長い距離を移動するのです。
どういう事かというとつまり、
原子炉から離れた地点であればあるほど、
こういった粒子(ホットパーティクル)を見つける可能性は
低くなるということです。
私達は日本から送られて来た
沢山のサンプルを調査しましたが、
これは最も長い距離を旅した粒子です。
個体識別番号を付けようと思っています。
In Japan, we measure radiation in Becquerels. A Becquerel is obviously named after someone. It’s named after Henri Becquerel. And a Becquerel means one radioactive disintegration per second. Now in Japan, if your food has more than 100 Becquerels in a kilogram, about 45 Becquerels in a pound, then it’s not considered safe to eat.The number is a bit higher in the United States, but if we use 100 Becquerels per kilogram as a guide – it’s something too radioactive to eat – this material was in the petabecquerel per kilogram range. Now you probably don’t hear that prefix very often.The number we’re looking at is 4 followed by 19 zeroes – that many becquerels per kilogram. That’s a very, very high number and essentially, that’s the kind of number you get when you look at core material.
日本では、放射能をベクレルという単位で計ります。
このベクレルというのはヘンリー•ベクレルという人の名前です。
1ベクレルというのは放射性物質が
1秒間に1つ原子が崩壊するということです。
現在日本では、1キロあたり100ベクレル、
これは1パウンドあたり45ベクレルになりますが、
これ以上のレベルの食物は食べるのは危険である
ということになっています。
アメリカの数値の方がもう少し高いのですが、
しかしもし1キロあたり
100ベクレル以下なら安全という方針に従うとすれば、
この物質(ホットパーティクルを指す)は、
食べるのには放射性が強過ぎますね。
この物質(ホットパーティクル)は
1キログラム当たりペタベクレルということになります。
ペタベクレルなんて聞きなれない名前でしょう。
4の後に、ゼロが19個並びます。
1キログラムあたり、
40,000,000,000,000,000,000(4千京)ベクレルです。
炉心の物質とうものはそれ程までに
放射性がとてつもなく高いものなのです。
It is a tiny particle – in fact, the total number of becquerels from the particle was only about 310 becquerels for the particle. And so when we got our vacuum cleaner bag, the entire vacuum cleaner bag clicked away on our counter at 310 becquerels, which is a little higher than average for our Fukushima Prefecture vacuum cleaner bags. So we didn’t think too much of it. Although everything is done in a glovebox or in a hood, when we separated the sample in half this is the first step in identifying if a hot particle was present – when we separated the sample in half and analyzed half the sample, you’d expect to get 155 becquerels – right? Half of 310. In fact, compared to background, we got none. So we said, all right, we’ll measure the other half. The other half – none. So where’d it go? We took the entire sample and put it in. We’re back to 310 becquerels. A bit of a mystery. Until we realized that the very center of the two samples – the razor knife that we’d used to collect this, had actually hit the hot particle and stuck to the razor.
とても小さな粒子ではありますが、
ベクレルではたったの310ベクレルでした。
この掃除機の内部のパックのサンプルを受け取った当初、
放射線を計測したら310ベクレルでした。
これは平均的な
福島県内の掃除機のゴミパックの放射線数値と
同じぐらいでしたので、
特に気をとめませんでした。
作業はグローブボックス
(放射性物質を扱うための小型の箱で
備えつけのゴム手袋によって外部から操作する)や
フード(覆いのようなもの)の下で作業をしたのですが、
私達はこのサンプルを半分にカットしました。
これはホットパーティクルが
存在しているかどうかについて調べる
第一のステップなのですが、
半分に切ったら当然、
まぁ半分の155ベクレルになるはずですよね?
310の半分ですから。
しかし実際にはゼロだったんです。
よし、じゃあもう半分のパックを計ってみよう、
そしたらそっちもゼロ。
あれ?どこに行っちゃったんだ?
それでもう一度両方のパックを
一緒に戻して計測しました。
そうしたらまたちゃんと310ベクレルと出ます、
ちょっとしたミステリーでした。
ホットパーティクルが
この掃除機のゴミパックのちょうど真ん中あたりに存在していて、
このパックを半分に切ったカッターナイフの刃に
くっついていたのだということに気付くまではね。
And so when we were able to put the razor under the microscope and carefully collect that hot particle and see just how much that was clicking away with the radiation detectors. So we short circuited the process a little bit, but that’s exactly the method that you would use to try and find a hot particle.You just keep dividing your sample until you can find the part that has that high radiation emit. If you look at the black dust – and we’ve received samples of that (13:11) from Namie and Litate and a couple of other communities in northern Japan, this is very similar to the black sand that people see.
私達はこのカッターナイフを
顕微鏡で注意深く見ながら
ひとつひとつの粒子の放射性を調べました。
プロセス自体はややショートカットしたワケですが、
実際にこれはホットパーティクルを見つける方法ですから。
高い放射能を出す部分を見つけるまで、
サンプルを切り分けていくわけです。
北日本にある浪江町と飯館村から送られてきたサンプル、
「黒い砂」を見てみると…
(この高放射性粒子は)非常に黒い砂と似ています。

The black sand – and this particle, too – it’s an aggregate, it’s a mixture. If you think of a hunk of concrete, it’s actually a mix of sand and cement and small stones, that’s what it looks like under the microscope.So essentially what we’re talking about is a worst case for black sand. That’s what this hot particle is. So this material was vaporized during the accident. It condenses into these small particles and then they aggregate. They congeal, they collect, and they make particles big enough to be detected. They fly around in the winds. And sooner or later they hit something and they stick to it.In the case of the Goya, the sample blew in with the outside air and appears to have just lodged somewhere into a carpet or floor material – something in the house that had been vacuum cleaned, and then collected in the vacuum cleaner bag.
黒い砂…
そしてこの粒子(ホットパーティクル)もそうなのですが、
集合体であり、混ざり合った物なのです。
例えばコンクリートは
砂とセメントと小さな石が混じり合った物です。
顕微鏡下ではそのように見えます。
黒い砂の正体について、最悪のケースを話しています。
ホットパーティクル(高放射性粒子)は、
事故(原発事故を指す)の最中に気化したものです。
それが凝縮して小さな粒子になり、
混ざり合った物です。
それらは凝結し、集まり、
そして確認できる大きさの粒子になるのです。
風に乗って移動します。
そして遅かれ早かれ、何か当たり、
それにくっつきます。
この名古屋からのサンプルの場合、
外部の空気中を漂っていた粒子が
何らかの理由で室内のカーペットに付着し、
それを掃除機が吸い上げたのです。
The good news is repeated sampling at the same location getting additional material from there, we’ve never found another particle like that. So it’s not like there’s anything about this particular house or that there’s according to our data more than one of these particles in the home. It doesn’t appear that there is. But it does tell me that it’s worth looking at for a particular area, what’s the probability of there being a hot particle present. This has such a big impact on people’s exposure, the potential health damages.
良いニュースとしては、
同じ場所からサンプルを受け取り続けていますが、
同じようなホットパーティクルはそれ以来
発見されていません。
この家が特別に何か問題があるという訳ではなく、
私達のデータによると、
この家からはこうしたホットパーティクルは
一つだけでした。
発見されなかったのです。
しかしこの事実はある特定の地域を調査して、
ホットパーティクルが他にも存在しているかを
確認してみる必要があることを示しています。
このようなホットパーティクルからの被爆によるダメージは、
多大な健康被害を引き起こす可能性があります。

So far, from our Japanese samples from Fukushima Prefecture and from Tokyo, about 25 percent of those samples contained at least a few measurable hot particles. Only one that was this hot. And this was the worst case. It doesn’t represent any kind of average, but it does tell you what’s possible. The bottom line is, now that I’ve had time to digest the entire set of samples and put the number of hot particles per sample in perspective, take this data and and prepare all this data for publication,
put it before a peer review panel at Worcester Polytechnic Institute, it’s good to see that it’s going to be possible to find a real exposure number, where we can take the average exposures that we’re used to dealing with and also add in a probability for being exposed to a hot particle, so that we can find out what the true level of potential health damage is from an accident.It is solid scientific material like this that you will not see or hear via traditional news stories, TEPCO, or the IAEA.
今のところ、
日本の福島県と東京からのサンプルについては、
25パーセントのサンプルは、
確認できるレベルのホットパーティクルを含んでいます。
しかしこの粒子(名古屋の掃除機ゴミパック内から発見された粒子)
が最悪のケースで、
一番高い放射能を持っていました。
平均の数値が示されるというわけではありませんが、
どんな可能性があるかを知ることはできます。
結果的として私は、
一連のサンプルについて十分に理解する時間をかけて、
整理しました。
それはウォーチェスターポリテクニックインスティトュートの
検討委員会(同領域も専門科によって査読、評価する機関)
によって検討されました。
そしてこれらの情報を
公に公表する為の準備をしました。
かつてのように平均の被爆量ではなく、
実際にどれだけ被爆をするであろうかが
分かるようになるという事は良いことだと思います。
そしてまたホットパーティクルによって
被爆する可能性についてや、
この福島の原発事故によって、
実際に受けるであろう健康被害の可能性についても
付け加えました。
このようにしっかりと研究されたデータや情報を
テレビのニュースや、東京電力の発表、
またはIAEAの発表で見聞きすることは
決して無いでしょう。
Fairewinds has long said that there will be significant increases in cancer in Japan as a result of the Fukushima Daiichi accident, and this video describing just one hot particle confirms our worst fears.
Thank you for viewing Fairewinds Energy Education.
This is Arnie Gundersen, and I’ll keep you informed.
フェアウインズは長い間、
福島の原発事故の結果として、
はっきりと明確に分かる程の
癌の増加が
日本で見られるようになるだろうと
お話してきました。
このビデオは
たった一つのホットパーティクルが
私達が恐れている最悪の事態を
確証しています。
フェアウインズ エナジー エジュケーションの
ビデオを見て下さってありがとうございます。
アーニーガンダーセンです、
今後も更なる情報の提供を続けさせて頂きます。
******************************************
とここまでが、ビデオの内容です。
次の記事では、
ガンダーセン氏に直接聞いて来た
未公開情報について、書きます。
お話を伺ってきました☆
の記事パート2です。

それでは...
まず、カルトフェン氏のビデオの内容の
日本語訳から紹介します。
特に重要な所は赤字にしてあります。
(直訳では意味が通じにくい箇所は意訳にしています)
Transcript “ The Hottest Particle”
「超高放射性粒子」
Hi, I am Arnie Gundersen from Fairewinds.
I am here today to introduce professional engineer Marco Kaltofen
in one of the most important videos Fairewinds Energy Education
has ever produced.
こんにちは、フェアウインズのアーニーガンダーセンです。
今日は、プロフェッショナルエンジニア(PE)である
マルコカルトフェン氏によるビデオをご紹介します。
このビデオは今までフェアウインズが発表してきた
数々のビデオの中でも、
非常に重要なものであるといえます。
Three years ago,Fairewinds was one of the first organizations
to talk about the “hot particles” that are scattered all over Japan and North America’s west coast.
Hot particles are dangerous and difficult to detect.
In this video Mr. Kaltofen discusses the hottest hot particle he has ever found,
and it was discovered more than 300 miles from the Fukushima Daiichi site.
If Fairewinds Energy Education was a Japanese website,
the State Secrets Law would likely prevent us from issuing this video.
I will provide a brief summary at the end of the video.
3年前、日本全土と北アメリカ沿岸に
ホットパーティクル(高放射性粒子)が降り注いだのですが、
この事実について語ったのは、
フェアウインズが一番最初の組織でした。
ホットパーティクル(高放射性粒子)は危険で、
探知することが難しい物質です。
このビデオの中で、カルトフェン氏は
なかでも非常に高い放射能を持つ
超高放射性粒子を発見したことついて語っています。
これは福島第一原発から
300マイル(482km)も離れた場所で
見つかりました。
もし私達フェアウインズのウェブサイトが
日本のウェブサイトであったなら、
秘密保護法によって
このビデオがリリースされないように
妨害されることでしょう。
このビデオの最後に簡単なまとめを、
私からお話したいと思います。
※ここからカルトフェン氏のビデオが始まる
I’m Marco Kalton.
I am a civil engineer and I’m a Ph.D candidate at Worcester Polytechnic Institute.
Most of my research looks at radioactive and chemical contaminants and how they wind up in house dust.
And the reason for doing that is this is
a very important way that the general public is exposed to things like radioactive contaminants.
In looking at indoor environments, they tend to be much more contaminated than the surroundings outside.
Houses act like a trap and they tend to collect outdoor contaminants.
And they expose people as much as 24 hours a day versus consider how short a time most people spend outdoors.
Your exposure is actually much less.
私はマルコカルトフェンです。
私はの土木関連の専門技師であり、
現在ウォーセスターポリテクニック研究所にて
博士号の取得過程にあります。
私が主にリサーチしているのは放射能汚染とケミカル汚染について、
またそれらの汚染物質がどのように
家屋の内部に蓄積していくのかについてです。
何故そのようなリサーチをするのかといいますと、
これは一般市民がどのように放射能汚染にさらされて
被爆をするのかを知る為にはとても重要なことだからです。
家屋内の環境に関して言えることは、
建物の内部というものは、外部よりも
汚染の度合いが高くなるという傾向があります。
家屋というものは外部の汚染を集めてしまうのです。
実際は家の外で汚染する被爆量の方が少ないということです。
1日24時間のうち、実際に建物の外にいる時間の方が、
通常は短いものですしね。
One of the nice things about social media is that we can talk to a lot of people
and hook up with volunteers and volunteer and scientific organizations.
And they were able to send us indoor dust samples,
whether it was a vacuum cleaner bag or a sample from a home air filter or something like an appliance filter
– think of an air conditioner filter or a heating and ventilation filter that people might have installed in their home.
And we actually have developed a very straight-forward method for prepping all of these samples.
And that way, we can compare people’s exposure from one house to another.
We looked at samples in Northern Japan;
we looked at samples in Tokyo; we looked at samples in the United States and Canada.
We tried to get a feel for what people’s actual exposure was.
ソーシャルメディア
(ブログやツイッター、フェイスブックやその他の様々な掲示板など)
の素晴らしいところは、
世界中の沢山の人々と話せる機会が得られること、
そして沢山のボランティアの方々や科学者達、またはそういった組織との
繋がりを得られることです。
そしてそうして出会った人達は、
エアフィルター等のサンプルを送ってくれました、
例えば家庭用の電気器具なんかの、そうですね、
彼らの家に設置してあったエアコンやヒーターのフィルターや、
換気扇のフィルター等です。
私達はこれらすべてのサンプルを、非常にシンプルな方法で処理し、
いろんな家の被爆度を比較検証しようとしました。
私達は北日本、東京、アメリカ、
そしてカナダからのサンプルに注目してみました。
実際に人々がそれくらい被爆しているのかを
知ろうとしたのです。
And that’s why we went looking for hot particles. The thing about radiation exposure is, if you look at it from a legal perspective, what you’re trying to do is find the average exposure that people get and then try and find some kind of safe level you can measure that against. And if you exceed that average level that you think is safe, then you have to start doing something about it; either institute some type of policy or some kind of cleanup.The difference with our work is, while we understand there’s an average concentration people get, some people get a much higher or a much lower concentration. And that depends on how many hot particles, how many radioactive dust particles from the original accident can make their way through the air into somebody’s home. And if they’re small enough to be ingested or inhaled, then you have to count that over and above what their average exposure could be. When you look at the two different components of people’s exposure – (1) your average exposure; and (2) your exposure from hot particles, your hot particle exposure is going to be more rare, because there is a comparatively small number of hot particles that are disbursed from a site. So most people won’t be exposed to any. But a few people will be exposed to one or more than one. And that exposure from the hot particle can actually be bigger than the average exposure that everyone is getting. So you have to measure both components if you really want to understand what’s happening to people. So when we get a sample, we actually have a whole series of analyses that we’re doing.
そのために私達はホットパーティクル(高放射性粒子)に着目しました。
放射能汚染に被爆するということを法的視点で考えると、
始めにそのエリアでの平均的な汚染度や被爆度を求め、
それからではこのぐらいなら大丈夫でしょうという、
安全なレベルというものを求めます。
もしもあなたがその安全なレベルと言われている
汚染度を超えて被爆していると考えるなら、
何らかの指針を設けて、対策をとる必要がありますね、
除染するなどして。
私達は被爆の平均値という物について理解すると同時に、
ある一定の人々は平均値よりも多く被爆するだろうし、
またある一定の人達は平均よりも被爆数値が低いだろうと考えます。
この考え方において私達の調査の事例は
他と異なります。
それは、どれくらいの量の放射能汚染された塵が、
原発事故の起きた場所(福島第一原発)から、
どのような経過をたどって
誰かの家に入り込むのかによるのです。
もしもそれらの放射能汚染された塵が、
食べ物と一緒に口の中に入ったり、
呼吸と一緒に肺の中へ吸い込める程に小さなものだったとしたら、
それは内部被爆として、
平均の汚染度や平均の被爆量と言われている数値の
何倍もの被爆をするということになるのです。
被爆数値の構成要素について考えてみましょう。
あなたが住んでる環境からの平均の被爆、
つまり外部被爆
ホットパーティクル(高放射性粒子)を
取り込むことによって被爆する
内部被爆
ホットパーティクル(高放射性粒子)による内部被爆は
そう多くはないといえるでしょう。
原発事故の起きた現場から放出された
ホットパーティクル(高放射性粒子)の数は比較的、
少ないからです。
ですから殆どの人は
このホットパーティクル(高放射性粒子)によって
内部被爆する事はないでしょう。
しかし、少数の人達は一粒か、
もしくは二粒以上のホットパーティクル(高放射性粒子)を
体の内部に取り込み、内部被爆をするでしょう。
このように内部被爆をすると、
外部被爆の平均値よりも被爆数値は高くなります。
ですから今、
実際に人々に何が起きているのかを知るためには、
この外部被爆と内部被爆の両方を考えて計算に入れる必要があります。
私達はサンプルを得た後、
一連の分析を得ることが出来ました。
We do some very basic analyses that give us the average exposure. We use something called gamma spectrometry. Gamma spectrometry has been around for nearly 100 years and we use that to see which isotopes, which radioactive materials are present in the sample.Now with Fukushima, we generally see three isotopes over and over again. And two of them are Cesium 134 and Cesium 137. When we see both of them in a certain ratio we can be fairly certain we’re looking at a material that’s contaminated with material from the Fukushima accident. Now that’s a fission product and that only comes after there’s been some kind of nuclear reaction. The other thing we’re looking at is Radium 226. And that’s actually related to the original uranium fuel that starts the nuclear process in the first place. So those three things are what we’re looking for when we’re doing our test for dust sample. And if we find them, then we go on to part 2 and try and identify if hot particles are present.
私達はまず基本的な分析をし、
平均の外部被爆の数値を算出しました。
私達はガンマスペクトロメトリーと呼ばれるものを使用しました。
このガンマスペクトロメトリーという物は、
過去100年以上に渡って使用されている技術であり、
どんな核種が、どんな放射性物質が
サンプルの中に存在しているのかを検査するものです。
福島からの放射能汚染の中に見られる
3種類の核種<があります。
まずは、セシウム134とセシウム137です。
この2つの核種の割合をみることによって、
私達はこの汚染が福島からの物であることを
かなり確実に特定することができます。
またこれらの核種は、
核分裂により生成物であり、
なんらかの核反応の後に生成される物質です。
3種類の核種のうちのもう一つがラジウム226です。
これはもともとのウラン燃料が
核分裂反応のプロセスを始める最初の段階で
生成されます。
もしこれらを見つけたら、
私達は第二段階、ホットパーティクルが
その中に存在しているかどうかを
鑑定する作業に進みます。
The way that happens is, once we’ve ID’d a sample that we want to take to the next level where we want to do the hot particle analysis, we actually sieve out some of the finer particles, and we spread them on a copper plate and we exposure them to X-ray film. We expose them for a week. Now this is another old technique. It’s probably more than a century old. But what happens is, it identifies the places in the dust sample where there might be a small, radioactively hot particle. We can actually develop that X-ray plate and if there’s a positive result from location, we just take an Exacto knife, we remove it, we put it onto an aluminum microscope slide, and it’s analyzed by a scanning electron microscope. Not just any old microscope, but one that can give us an actual elemental analysis as we’re going along. So imagine you’re looking through the microscope. It’s all done on video these days. And you can actually see all the individual particles magnified maybe as much as 5,000, 10,000, 15,000X. And as you’re scanning, you’ve got a joystick and a set of crosshairs. Think of a videogame. And you can zap each particle one at a time with an X-ray beam and you can actually weed out which elements are present. And when you’re starting to see the radioactive elements – plutonium, Americium, uranium, radium, then you know you’re getting somewhere. So we can actually, through this process, take a sample that might weigh a pound or two pounds – a half a kilo, a full kilo, and isolate as few as one or two hot particles from that entire sample.
どういう風にするのかというと、
ホットパーティクルの分析を行うという
第二段階へ進める為に鑑定したサンプルをふるいにかけ、
よりさらに細かい粒子に分け、
銅製のプレートの上に薄く伸ばし、
それをX線用のフィルムに感光させるのです。
1週間、感光させておきます。
これはまた別の古くから行われているテクニックです。
おそらく一世紀以上前から。
サンプルの塵の中から、どこに小さな放射性の,
ホットパーティクルがあるのかを見極めることができます。
その感光させたX線用フィルムを焼き増しすることもできます。
そしてもし可能性のある箇所が見つかったら、
その部分だけをイグザクトナイフ* で切り取ります。
それをアルミニウム製の顕微鏡用スライドの上にのせ、
電子顕微鏡でさらに細かく調べます。
※イグザクトナイフ* 細かいところを切り抜く為のカッター
普通の顕微鏡ではなく、
見ながら元素の分析をすることが可能な
特別な電子顕微鏡を使います。
では実際にこの電子顕微鏡で
見ているイメージをしてみましょう。
スクリーンで実際に映像として見ることができるのです。
ひとつひとつの粒子を
五千倍、一万倍、一万5千倍に拡大して
見ることができます。
これを見ながら顕微鏡の操作レバーを操り、
粒子のひとつに焦点を合わせるのです。
ビデオゲームのようなものです。
粒子のひとつひとつにX線ビームを当てて、
その元素の構成についての分析処理をしていくのです。
そうしていくうちに、
放射性の粒子を見つけるのです。
それらはプルトニウムであったり、
ウラニウム、ラジウムだったりします。
分析に使用するサンプルは0.5キロか1キロ分程の塵なのですが、
この塵の粒子の中から、このようなプロセスを経て、
一粒か、二粒程のホットパーティクル(高放射性粒子)を見つけて
取り出す作業になります。
And then do a full analysis and a breakdown. And that’s extremely valuable to us. It tells us a lot about what might happen if someone inhaled or ingested that particle.All hot particles are not alike. Some are modestly elevated. They’re a little bit more radioactive than their surroundings. These are awfully hard to detect. But others tend to be orders of magnitude, factors of 10 more contaminated than their surroundings. Think the Richter scale where an earthquake magnitude 5 is 100 times more powerful than an earthquake magnitude 3. That’s what we’re looking for with hot particles, not things that are just a little bit more radioactive, but much more.We get those – those highly radioactive particles – even though they’re small, they can give us a lot of information about where they came from because we can actually see it in the microscope. We can see how big it is, we can see what shape it is. It really gives a history of what happened to the particle. And it gives a fingerprint of where that particle came from. And the last step, if we know how big it is and we know its elemental composition and how radioactive it is, we can actually tell exactly how dangerous that particle will be if you happen to inhale it or if you happen to ingest it.
そして更に細かい分析を行います。
これは非常に意味のある大切な作業です。
なぜかというと、もしこの小さな粒子を
誰かが呼吸として吸いこんだり、
または食べ物に混入して体内に入ってしまった場合に、
何が起こるかが分かるからです。
すべてのホットパーティクルは似ておらず、
それぞれ違っています。
幾つかの放射性粒子は、
他の放射性粒子よりもやや高い放射能を持っています。
それらを見つけ出すのは非常に難しいです。
また別のある粒子は、
ちょうど*マグニチュードと地震エネルギーの対数関係のように、
10の指数倍で表さなければならない程の
強烈な放射能を持っています。
補足*マグニチュードは地震のエネルギーと対数関係にあり、
マグニチュードが2増えるとエネルギーは1000倍になる。
つまり一般的な放射性粒子と比べて、
高放射性粒子であるホットパーティクルは
2倍とか3倍汚染度が強いというレベルの話ではなく、
とてつもなく放射性が高いという意味。
リクタースケール
(マグニチュードと地震エネルギーの対数関係を表すグラフ)
について考えてみると、
マグニチュード5というのは、マグニチュード3よりも
100倍も強い地震エネルギーを持っています。
私達が探している
ホットパーティクル(高放射性粒子)と言う物は
つまりそういうもであって、
一般の放射性粒子よりも、ちょっとだけ放射性が高いとか、
そういうレベルの話ではないんです。
とてつもなく高いのです。
私達はそれらを見つけたのです、
そのとてつもなく高い放射能を持った粒子を。
とても小さな粒子ですが、
何処から来たものなのか、私達に教えてくれます、
なぜなら(先ほど話した特別な)
電子顕微鏡で見ることができるからです。
どれくらいの大きさなのか、
どんな形をしているのかを見ることができます。
この粒子がどのような経過を辿ってきたのか、
またはその証拠を知ることができるのです。
そして最終ステップとしては、
もしこの粒子のサイズ、原子構成、放射能の強さ等を
知ることができれば、
この粒子を吸い込んだり、経口摂取すれば
どうなるかも知ることができます。
You can say, well, we don’t know what might happen to a particular person, we just know what the average is. Well, that’s true of non-hot particle testing. But with this, we can take a hot particle and say, all right, the person in this household, if that person had inhaled this particular particle, their odds would be 7 percent or 70 percent of contracting a lung cancer or an epithelial tissue cancer or a nasal pharyngeal cancer.You can actually see which one of these is more likely once you have the photograph of the particle. So it’s a time consuming analysis but it tells us a lot about what the potential hazards are.
「実際にはどの人に何が起こるかなんて分からないじゃないか、
私達にはただ(健康障害が起こる)確立の平均値しか分からないだろう。」
そうあなたは思いますか。
そうですね、一般的な放射性粒子に関しては
おそらくそうでしょう。
でもこホットパーティクル(高放射性粒子)に関しては、
7%の人が肺癌になるとか、
あるいは70%の人が皮膚癌になるとか、
喉頭癌になる可能性があるだろうというふうに
はっきり言うことができます。
そういった粒子たちの画像を実際に見ることができます。
とても時間のかかる分析ですが、
どのような健康被害が起こるかその危険性について
多くの事を知ることができます。

And it’s a good way to diagnose which areas are going to have which times of potential health damages.The sample that we got came from the Goya in Japan. It’s 460 kilometers from the accident site. That’s about 300 miles away. The hot particle was 10 microns across. That means it is 10 one-millionth of a meter across; obviously, something you’re only going to see with a powerful microscope. The particle was actually in the size range of dusts that can be inhaled and then retained in the lungs.And this is important because if you’re a health physicist and you’re calculating the dose that you would get from this particle, you’d have to consider that this particle might actually be trapped and result in a lifetime exposure.Thing of asbestos workers who inhaled an asbestos particle and when they eventually died, from whatever reason, that asbestos particle is still in their lungs. Well, this kind of hot particle would probably do something very, very similar.The particle that we examined was a mixture of fission products from a nuclear reactor and nuclear fuels. We looked at materials like Telurium, Radium 226.We saw Cesium 134 and 137, Cobalt 60 and a whole zoo of isotopes that probably you’ll never hear about on CNN but you’d have to be a physicist to understand. Let’s put it this way.
どの地域で、
何倍の健康被害があるかについてを知る
良い方法です。
私達の得たサンプルは日本の名古屋からの物でした。
460キロメートル福島の第一原発から離れたところです。
約300マイルです。
ホットパーティクル(高放射性粒子)は
10マイクロ幅でした。
0.00005mの大きさということです。
当然のごとく、とても高い性能を持った顕微鏡でしか
見ることができません。
呼吸として容易に吸い込める大きさであり、
また肺の中にとどまることもできるサイズです。
これはとても重要なことなのです、
何故なら、もしあなたが保健物理学者なら、
このホットパーティクルからの被爆量の計算をし、
この粒子は障害体内に残り、
被爆し続けるものとして考察する必要があるからです。
アスベストを取り扱った為に、
アスベストの粒子を吸引した労働者が亡くなったとします。
死因はさておいて、
アスベストの粒子はそれでもまた彼らの体内に残っています。
ホットパーティクル(高放射性粒子)にも
ほぼ同じことが言えます。
私達が調査した粒子は原子炉の中で
核分裂したことによって出た物質と
核燃料そのものの混ざり合ったものでした。
テルルとラジウム226です。
またセシウム134と137、コバルト60、
その他にも、めったにCNN(アメリカのニュース番組)の放送でも聞かないような、
物理学しか知らないような、
そんな名前の核種の数々を見ました。

Eighty percent by weight of this particle was made up of pure reactor core materials. So that tells me that something that came directly from the accident, directly from the core, could escape containment and travel a very, very significant distance.So it’s a long distance to travel, and what happens is the particle is so very small that it will essentially travel with whatever gas it’s entrained in. The winds will blow it long distances.What’s going to happen is the further you get away from the reactor, the less likely you are to find a hot particle of this magnitude. But of course we’ve looked at so many samples from Japan, this just happens to be the longest distance and the hottest particle that we’ve found. I have to put some numbers on it.
この粒子の重量の80%は、
原子炉の炉心の物質です。
この粒子は事故のあった原子炉の炉心から
とても長い距離を旅してやってきたのです。
とても長い距離の移動です、
この粒子はとても小さいので、
気体となって風に乗ると、
とても長い距離を移動するのです。
どういう事かというとつまり、
原子炉から離れた地点であればあるほど、
こういった粒子(ホットパーティクル)を見つける可能性は
低くなるということです。
私達は日本から送られて来た
沢山のサンプルを調査しましたが、
これは最も長い距離を旅した粒子です。
個体識別番号を付けようと思っています。
In Japan, we measure radiation in Becquerels. A Becquerel is obviously named after someone. It’s named after Henri Becquerel. And a Becquerel means one radioactive disintegration per second. Now in Japan, if your food has more than 100 Becquerels in a kilogram, about 45 Becquerels in a pound, then it’s not considered safe to eat.The number is a bit higher in the United States, but if we use 100 Becquerels per kilogram as a guide – it’s something too radioactive to eat – this material was in the petabecquerel per kilogram range. Now you probably don’t hear that prefix very often.The number we’re looking at is 4 followed by 19 zeroes – that many becquerels per kilogram. That’s a very, very high number and essentially, that’s the kind of number you get when you look at core material.
日本では、放射能をベクレルという単位で計ります。
このベクレルというのはヘンリー•ベクレルという人の名前です。
1ベクレルというのは放射性物質が
1秒間に1つ原子が崩壊するということです。
現在日本では、1キロあたり100ベクレル、
これは1パウンドあたり45ベクレルになりますが、
これ以上のレベルの食物は食べるのは危険である
ということになっています。
アメリカの数値の方がもう少し高いのですが、
しかしもし1キロあたり
100ベクレル以下なら安全という方針に従うとすれば、
この物質(ホットパーティクルを指す)は、
食べるのには放射性が強過ぎますね。
この物質(ホットパーティクル)は
1キログラム当たりペタベクレルということになります。
ペタベクレルなんて聞きなれない名前でしょう。
4の後に、ゼロが19個並びます。
1キログラムあたり、
40,000,000,000,000,000,000(4千京)ベクレルです。
炉心の物質とうものはそれ程までに
放射性がとてつもなく高いものなのです。
It is a tiny particle – in fact, the total number of becquerels from the particle was only about 310 becquerels for the particle. And so when we got our vacuum cleaner bag, the entire vacuum cleaner bag clicked away on our counter at 310 becquerels, which is a little higher than average for our Fukushima Prefecture vacuum cleaner bags. So we didn’t think too much of it. Although everything is done in a glovebox or in a hood, when we separated the sample in half this is the first step in identifying if a hot particle was present – when we separated the sample in half and analyzed half the sample, you’d expect to get 155 becquerels – right? Half of 310. In fact, compared to background, we got none. So we said, all right, we’ll measure the other half. The other half – none. So where’d it go? We took the entire sample and put it in. We’re back to 310 becquerels. A bit of a mystery. Until we realized that the very center of the two samples – the razor knife that we’d used to collect this, had actually hit the hot particle and stuck to the razor.
とても小さな粒子ではありますが、
ベクレルではたったの310ベクレルでした。
この掃除機の内部のパックのサンプルを受け取った当初、
放射線を計測したら310ベクレルでした。
これは平均的な
福島県内の掃除機のゴミパックの放射線数値と
同じぐらいでしたので、
特に気をとめませんでした。
作業はグローブボックス
(放射性物質を扱うための小型の箱で
備えつけのゴム手袋によって外部から操作する)や
フード(覆いのようなもの)の下で作業をしたのですが、
私達はこのサンプルを半分にカットしました。
これはホットパーティクルが
存在しているかどうかについて調べる
第一のステップなのですが、
半分に切ったら当然、
まぁ半分の155ベクレルになるはずですよね?
310の半分ですから。
しかし実際にはゼロだったんです。
よし、じゃあもう半分のパックを計ってみよう、
そしたらそっちもゼロ。
あれ?どこに行っちゃったんだ?
それでもう一度両方のパックを
一緒に戻して計測しました。
そうしたらまたちゃんと310ベクレルと出ます、
ちょっとしたミステリーでした。
ホットパーティクルが
この掃除機のゴミパックのちょうど真ん中あたりに存在していて、
このパックを半分に切ったカッターナイフの刃に
くっついていたのだということに気付くまではね。
And so when we were able to put the razor under the microscope and carefully collect that hot particle and see just how much that was clicking away with the radiation detectors. So we short circuited the process a little bit, but that’s exactly the method that you would use to try and find a hot particle.You just keep dividing your sample until you can find the part that has that high radiation emit. If you look at the black dust – and we’ve received samples of that (13:11) from Namie and Litate and a couple of other communities in northern Japan, this is very similar to the black sand that people see.
私達はこのカッターナイフを
顕微鏡で注意深く見ながら
ひとつひとつの粒子の放射性を調べました。
プロセス自体はややショートカットしたワケですが、
実際にこれはホットパーティクルを見つける方法ですから。
高い放射能を出す部分を見つけるまで、
サンプルを切り分けていくわけです。
北日本にある浪江町と飯館村から送られてきたサンプル、
「黒い砂」を見てみると…
(この高放射性粒子は)非常に黒い砂と似ています。

The black sand – and this particle, too – it’s an aggregate, it’s a mixture. If you think of a hunk of concrete, it’s actually a mix of sand and cement and small stones, that’s what it looks like under the microscope.So essentially what we’re talking about is a worst case for black sand. That’s what this hot particle is. So this material was vaporized during the accident. It condenses into these small particles and then they aggregate. They congeal, they collect, and they make particles big enough to be detected. They fly around in the winds. And sooner or later they hit something and they stick to it.In the case of the Goya, the sample blew in with the outside air and appears to have just lodged somewhere into a carpet or floor material – something in the house that had been vacuum cleaned, and then collected in the vacuum cleaner bag.
黒い砂…
そしてこの粒子(ホットパーティクル)もそうなのですが、
集合体であり、混ざり合った物なのです。
例えばコンクリートは
砂とセメントと小さな石が混じり合った物です。
顕微鏡下ではそのように見えます。
黒い砂の正体について、最悪のケースを話しています。
ホットパーティクル(高放射性粒子)は、
事故(原発事故を指す)の最中に気化したものです。
それが凝縮して小さな粒子になり、
混ざり合った物です。
それらは凝結し、集まり、
そして確認できる大きさの粒子になるのです。
風に乗って移動します。
そして遅かれ早かれ、何か当たり、
それにくっつきます。
この名古屋からのサンプルの場合、
外部の空気中を漂っていた粒子が
何らかの理由で室内のカーペットに付着し、
それを掃除機が吸い上げたのです。
The good news is repeated sampling at the same location getting additional material from there, we’ve never found another particle like that. So it’s not like there’s anything about this particular house or that there’s according to our data more than one of these particles in the home. It doesn’t appear that there is. But it does tell me that it’s worth looking at for a particular area, what’s the probability of there being a hot particle present. This has such a big impact on people’s exposure, the potential health damages.
良いニュースとしては、
同じ場所からサンプルを受け取り続けていますが、
同じようなホットパーティクルはそれ以来
発見されていません。
この家が特別に何か問題があるという訳ではなく、
私達のデータによると、
この家からはこうしたホットパーティクルは
一つだけでした。
発見されなかったのです。
しかしこの事実はある特定の地域を調査して、
ホットパーティクルが他にも存在しているかを
確認してみる必要があることを示しています。
このようなホットパーティクルからの被爆によるダメージは、
多大な健康被害を引き起こす可能性があります。

So far, from our Japanese samples from Fukushima Prefecture and from Tokyo, about 25 percent of those samples contained at least a few measurable hot particles. Only one that was this hot. And this was the worst case. It doesn’t represent any kind of average, but it does tell you what’s possible. The bottom line is, now that I’ve had time to digest the entire set of samples and put the number of hot particles per sample in perspective, take this data and and prepare all this data for publication,
put it before a peer review panel at Worcester Polytechnic Institute, it’s good to see that it’s going to be possible to find a real exposure number, where we can take the average exposures that we’re used to dealing with and also add in a probability for being exposed to a hot particle, so that we can find out what the true level of potential health damage is from an accident.It is solid scientific material like this that you will not see or hear via traditional news stories, TEPCO, or the IAEA.
今のところ、
日本の福島県と東京からのサンプルについては、
25パーセントのサンプルは、
確認できるレベルのホットパーティクルを含んでいます。
しかしこの粒子(名古屋の掃除機ゴミパック内から発見された粒子)
が最悪のケースで、
一番高い放射能を持っていました。
平均の数値が示されるというわけではありませんが、
どんな可能性があるかを知ることはできます。
結果的として私は、
一連のサンプルについて十分に理解する時間をかけて、
整理しました。
それはウォーチェスターポリテクニックインスティトュートの
検討委員会(同領域も専門科によって査読、評価する機関)
によって検討されました。
そしてこれらの情報を
公に公表する為の準備をしました。
かつてのように平均の被爆量ではなく、
実際にどれだけ被爆をするであろうかが
分かるようになるという事は良いことだと思います。
そしてまたホットパーティクルによって
被爆する可能性についてや、
この福島の原発事故によって、
実際に受けるであろう健康被害の可能性についても
付け加えました。
このようにしっかりと研究されたデータや情報を
テレビのニュースや、東京電力の発表、
またはIAEAの発表で見聞きすることは
決して無いでしょう。
Fairewinds has long said that there will be significant increases in cancer in Japan as a result of the Fukushima Daiichi accident, and this video describing just one hot particle confirms our worst fears.
Thank you for viewing Fairewinds Energy Education.
This is Arnie Gundersen, and I’ll keep you informed.
フェアウインズは長い間、
福島の原発事故の結果として、
はっきりと明確に分かる程の
癌の増加が
日本で見られるようになるだろうと
お話してきました。
このビデオは
たった一つのホットパーティクルが
私達が恐れている最悪の事態を
確証しています。
フェアウインズ エナジー エジュケーションの
ビデオを見て下さってありがとうございます。
アーニーガンダーセンです、
今後も更なる情報の提供を続けさせて頂きます。
******************************************
とここまでが、ビデオの内容です。
次の記事では、
ガンダーセン氏に直接聞いて来た
未公開情報について、書きます。