This work is being led by Lauren Gardner at Johns Hopkins University CSSE, in collaboration with Aleksa Zlojutro and David Rey at rCITI at UNSW Sydney, and Ensheng Dong at JHU CSSE. At JHU, we have previously developed an interactive dashboard mapping the outbreak in real-time, and a written a blog.
Model Implementation
We implemented a previously published model that integrates both outbreak dynamics and outbreak control into a decision-support tool for mitigating infectious disease pandemics at the onset of an outbreak through border control Only a subset of U.S. airports are listed in the top 100 globally. A stochastic metapopulation epidemic simulation tool is used to simulate global outbreak dynamics, and the border control mechanism considered is passenger screening upon arrival at airports (entry screening), which is used to identify infected or at-risk individuals. More detail on the model is available in the supplementary file.
Our metapopulation model is based on a global network of local, city-level, populations connected by edges representing passenger air travel between cities. At each node of the network, we locally model outbreak dynamics using a discrete-time Susceptible-Exposed-Infected-Recovered (SEIR) compartmental model. IATA monthly passenger travel volumes for all travel routes connecting airport pairs (including stopovers) is used to construct the weighted edges. The SEIR parameters are defined based on a 10 day period from exposure to recovery, aligning with a previously published report, divided into a 5 day latent period and 5 day recovery period. The effective contact rate corresponds to a reproductive number of 2, which aligns with an estimate from Imperial College London, reporting a range between 1.5 and 3.5. We assume initial cases of 2019-nCoV are only present in Wuhan, and no border control is accounted for. The model results presented are based on an average of 250 runs.
Results
The simulation model is run for a time period between the start of the outbreak, up until January 25. We then estimate the expected number of cases in mainland China, as well as the global distribution of the infected travelers.
We estimate 40 cases of 2019-nCoV to have been exported outside of mainland China by January 25, as was reported, at which point we believe the number of 2019-nCoV cases in mainland China are likely much higher than that reported throughout January. Specifically, we estimate there to be around 20,000 cases of 2019-nCoV in mainland China on January 25 (at which time closer to 2000 were reported). We also estimate there were already hundreds of human cases of 2019-nCoV in Wuhan in early December. The estimated verses confirmed cases during January are presented in Figure 1. Our estimates are slightly higher than those from two other modeling exercises, namely, a report out of Imperial College estimated 4000 cases in mainland China on January 18, and a report out of Northeastern University estimated 12,700 on January 24. However, there was a substantial and rapid increase in reported cases outside of China during these dates, which is still occurring, and likely to lead to higher estimates than those in this study.
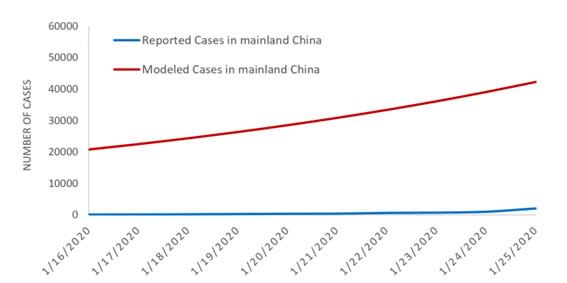
Figure 1. Estimated vs. Reported Cases of 2019 n-CoV cases globally.
The simulation provides the expected number of imported cases arriving at each airport globally (based on final travel destinations of travelers) as of Jan 25. By aggregating this over all airports in a country we can estimate the total number of imported cases in each country. Figure 2 below illustrates our estimated number of imported cases arriving in each country compared with the number of 2019-nCoV reported cases as of January 26. The results align with the number of air travel reported cases outside of mainland China early in the outbreak. Specifically, the 12 countries/regions we identify at highest risk have all reported at least one case.

Figure 2. List of Countries/Regions with highest risk of imported 2019-nCoV cases.
We further present the results at the airport level (based on their final travel destination), to identify the set of cities inside and outside China at highest risk of case importation. The top 50 airports in China and outside of China are illustrated in Figure 3 and 4 below, respectively, and listed in Table 1 and 2 in the supplementary file. The cities at highest risk are generally those in China that receive high direct or indirect travel from WUH. While many of the cities outside China that we identify at high risk have already reported cases, these cities should be prepared for additional cases to be reported over the coming days, likely in travelers whom departed Wuhan before the travel ban was implemented on January 23. In the U.S., our high risk airports have already been designated for screening by the CDC, namely LAX, JFK, SFO, ATL and ORD. By considering complete travel paths (with stopover airports), we identify additional airports that are at risk of exposure to infected travelers, and suggest the international airports in Seattle, Washington-Dulles, Newark, Detroit, Boston, Houston, Las Vegas, Dallas Fort Worth and Honolulu in the U.S., also be considered for enhanced screening and security.
https://systems.jhu.edu/research/public-health/ncov-model/
コロナウイルスの感染マップを公開のジョンズ・ホプキンス大、ハイリスク空港50を予測
https://getnews.jp/archives/2379312