2024.08.06
(2)イーサリアム(ETH)価格が620日間高値に達する-次は3,000米ドルか? Ethereum (ETH) Price Reaches 620-Day High – Is USD3,000 Next?
![]()
テーマ:英語のお勉強日記(7960)
カテゴリ:イーサリアム
However, in the case of LDO, its growth as a network shows substantial progress. Its total Value Locked (TVL) is at an all-time high of $21 billion. In contrast, Ethereum’s TVL of $85 billion is well below its all-time high of $192 billion.
しかし、LDOの場合、ネットワークとしての成長は大きな進歩を示しています。その全預託暗号資産額(TVL)は、過去最高の210億ドルです。対照的に、イーサリアムのTVLは850億ドルで、過去最高値の1,920億ドルを大きく下回っています。
Mr. Heil correctly suggested that once the Bitcoin ETF narrative dies down, Ethereum will be next. The ETH/BTC pair showed strong signs of the bottom the day the fake ETF approval tweet came out.
ハイル氏は、ビットコインETFの物語が終われば、次にイーサリアムになると正しく示唆しました。ETH/BTCペアは、偽のETF承認ツイートが出た日に底の強い兆候を示しました。
Regarding Ethereum vs Solana, Mr. Heil states that:
イーサリアムとソラナについて、ハイル氏は次のように述べています。
The prevailing narrative around Ethereum rightly calls out the high transaction fees and a user experience that seems more tailored to large investors than to everyday users. Yet, the reality is that Ethereum deliberately prioritizes long-term security and scalability over the immediate user experience. This strategy aligns with protocols that seek to attract investors who place a higher value on security than on quick, low-cost transactions.
イーサリアムをめぐる一般的な物語は、高い取引手数料と、日常のユーザーよりも大規模な投資家向けに調整されたように見えるユーザー体験を正しく指摘しています。しかし、現実には、イーサリアムは直接的なユーザー体験よりも長期的なセキュリティと拡張可能性を意図的に優先しています。この戦略は、迅速で低コストの取引よりもセキュリティに高い価値を置く投資家を引き付けようとするプロトコルと一致しています。
As for the Blueberry Protocol, which Mr. Heil is leading, the DeFi terminal will launch on January 23, while its governance token BLB will launch on March 23.
ハイル氏が率いるブルーベリプロトコルについては、DeFiターミナルが1月23日に立ち上げられ、その統治トークンであるBLBが3月23日に発売されます。
Read More: How to Buy Ethereum
続きを読む: イーサリアムの購入方法
Ethereum Price Prediction: Where to Next?
イーサリアム価格予測: 次はどこへ?
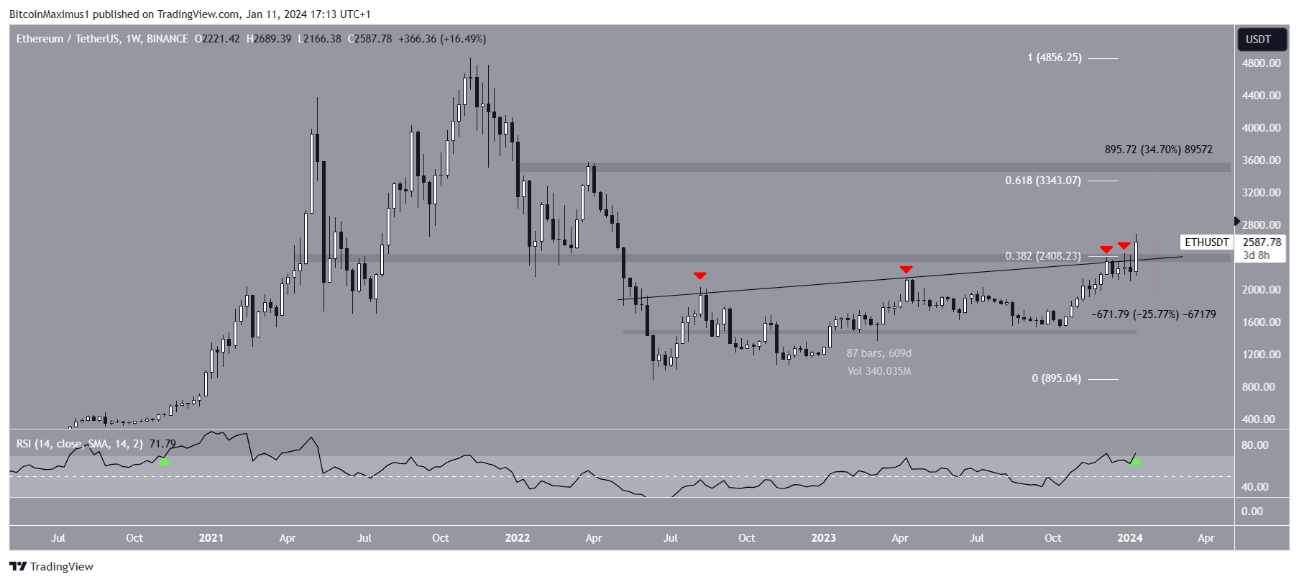
The technical analysis from the weekly time frame shows that the ETH price has increased in a gradual trajectory since May 2022.
週足のテクニカル分析によると、ETH価格は2022年5月以降、緩やかな軌道で上昇しています。
ETH traded below the $2,410 resistance area and an ascending resistance trend line during this time. The $2,410 area is critical since it is both a horizontal and the 0.382 Fib retracement resistance level.
この期間、ETHは2,410ドルのレジスタンスエリアと上昇するレジスタンストレンドラインを下回って取引されました。2,410ドルのエリアは、水平ラインと0.382フィボナッチリトレースメントのレジスタンスレベルの両方であるため、重要です。
After four unsuccessful attempts (red icons), the ETH price finally broke out this week, culminating with a high of $2,689. At the breakout, the trend line had been in place for more than 600 days.
4回の試み(赤いアイコン)に失敗した後、ETH価格は今週ついにブレイクアウトし、最高値2,689ドルで最高潮に達しました。ブレイクアウト時には、トレンドラインは600日以上にわたって存在していました。
The weekly Relative Strength Index (RSI) supports this increase. Market traders use the RSI as a momentum indicator to identify overbought or oversold conditions and to decide whether to accumulate or sell an asset.
週次相対力指数(RSI)は、この上昇を裏付けています。市場トレーダーは、RSIをモメンタム指標として使用して、買われ過ぎまたは売られ過ぎの状況を特定し、資産を蓄積するか売却するかを決定します。
Readings above 50 and an upward trend indicate that bulls still have an advantage, whereas readings below 50 suggest the opposite. The RSI is increasing and crossed into overbought territory (green icon). In the previous cycle, this preceded an increase to an all-time high.
50を超える数値と上昇傾向は、強気派がまだ有利であることを示していますが、50未満の測定値はその逆を示しています。RSIは増加しており、買われ過ぎの領域(緑のアイコン)に突入しています。前のサイクルでは、これは過去最高への上昇に先行していました。
If the ETH increase continues, the closest resistance area will be between $3,340 and $3,500, 35% above the current price. The 0.618 Fib retracement resistance level and a horizontal resistance area create the resistance.
ETHの上昇が続く場合、最も近いレジスタンスエリアは3,340ドルから3,500ドルの間になり、現在の価格を35%上回ります。0.618フィボナッチリトレースメントのレジスタンスレベルと水平方向のレジスタンスエリアがレジスタンスを作り出します。

ETH/USDT Weekly Chart. Source: TradingView
ETH/USDT週足チャート。出典:TradingView
Despite this bullish ETH price prediction, a weekly close below the ascending resistance trend line will invalidate the breakout. Then, ETH can fall 25% to the closest support at $2,000.
この強気のETH価格予測にもかかわらず、上昇する抵抗トレンドラインを下回る週足の終値はブレイクアウトを無効にします。その後、ETHは2,000ドルの最も近いサポートまで25%下落する可能性があります。
For BeInCrypto’s latest crypto market analysis, click here.
BeInCryptoの最新の暗号市場分析については、ここをクリックしてください。
DISCLAIMER
免責事項
In line with the Trust Project guidelines, this price analysis article is for informational purposes only and should not be considered financial or investment advice. BeInCrypto is committed to accurate, unbiased reporting, but market conditions are subject to change without notice. Always conduct your own research and consult with a professional before making any financial decisions. Please note that our Terms and Conditions, Privacy Policy, and Disclaimers have been updated.
Trust Projectのガイドラインに沿って、この価格分析の記事は情報提供のみを目的としており、金融または投資のアドバイスと見なされるべきではありません。BeInCryptoは、正確で偏りのない報告に取り組んでいますが、市場の状況は予告なしに変更される場合があります。金融上の決定を下す前に、常に自分で調査を行い、専門家に相談してください。当社の利用規約、プライバシーポリシー、および免責事項が更新されました。
Share on TwitterShare on EmailShare on Linkedin
Twitterで共有、メールで共有、Linkedinで共有
Valdrin Tahiri
ヴァルドリン・タヒリ
READ FULL BIO
全履歴を読む
Valdrin discovered cryptocurrencies while he was getting his MSc in Financial Markets from the Barcelona School of Economics. Shortly after graduating, he began writing for several different cryptocurrency related websites as a freelancer before eventually taking on the role of BeInCrypto's Senior Analyst.
バルドリンは、バルセロナ・スクール・オブ・エコノミクスで金融市場の修士号を取得しているときに暗号通貨を発見しました。卒業後まもなく、彼はフリーランサーとしていくつかの異なる暗号通貨関連のウェブサイトに執筆を始め、最終的にはBeInCryptoのシニアアナリストの役割を引き受けました。
=========================
インターネット・コンピュータランキング
=========================
ネットサービスランキング
=========================
