2024.03.30
![]()
(1)ビットコインの歴史的な移動平均(MA)クロスオーバー:竜巻が来るか、市場の偽物か? Bitcoin’s Historic MA Crossover: Tornado Coming or Market Fake-Out?
![]()
テーマ:英語のお勉強日記(7836)
カテゴリ:ビットコイン
Bitcoin’s Historic MA Crossover: Tornado Coming or Market Fake-Out?
ビットコインの歴史的な移動平均(MA)クロスオーバー:竜巻が来るか、市場の偽物か?
Let’s unravel the mystery behind the first-ever 100-week MA dip below 200-week MA!
史上初の100週移動平均線が200週移動平均線を下回った謎を解き明かそう!

Subhashish C.
スバシシ C.
Nov 4, 2023
2023 年 11 月 4 日
In an unprecedented event that has left investors and analysts on the edge of their seats,
投資家やアナリストを窮地に追いやった前代未聞の出来事で、
Bitcoin has just witnessed its 100-week moving average (MA) dip below the 200-week MA for the first time in its history.
ビットコインは、100週移動平均(MA)が史上初めて200週移動平均線を下回るのを目撃しました。
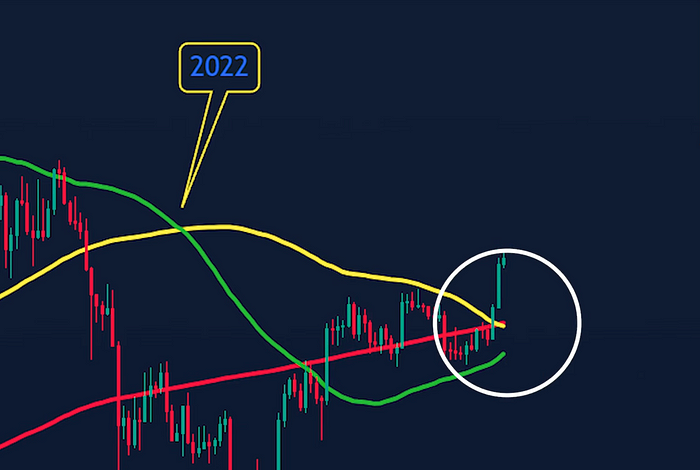
100-week MA crosses 200-week MA for the first time
100週移動平均線が初めて200週移動平均線を突破
This technical development has raised the question: are we on the cusp of a major market downturn, or could this be a deceptive signal that will catch many off-guard?
この技術開発は、市場が大きく落ち込む寸前なのか、それとも多くの人を不意打ちする欺瞞的なシグナルなのか、という疑問を投げかけています。
In this article, we will delve into the details to uncover the truth behind this historical market movement.
この記事では、この歴史的な市場の動きの背後にある真実を明らかにするために、詳細を掘り下げます。
What’s Been the Significance of Moving Averages in Bitcoin’s History?
ビットコインの歴史の中で移動平均線の意義は何か?
Moving averages have long been used as indicators of market trends, providing insights into the potential direction of asset prices.
移動平均線は、市場動向の指標として長い間使用され、資産価格の潜在的な方向性に関する洞察を提供してきました。
For Bitcoin, the 50, 100, and 200-week MAs have been particularly noteworthy.
ビットコインの場合、50週、100週、および200週のMAは特に注目に値します。
Historically, the 200-week MA has acted as a robust support level during the market’s darkest hours. It held firm during the 2015 and 2019 market bottoms and even during the unexpected COVID-19 crash.
歴史的に見ると、200週移動平均線は、市場の最も暗い時間帯に堅調なサポートレベルとして機能してきた。2015年と2019年の市場の底値の間、そして予期せぬCOVID-19の暴落の間も堅調に推移しました。
However, 2023 marked a departure from this trend, with Bitcoin falling through the 200-week MA for the first time, signaling a potential shift in market dynamics.
しかし、2023年はこの傾向からの逸脱を示し、ビットコインは初めて200週間MAを下回り、市場のダイナミクスの潜在的な変化を示しています。
What’s The 5.3 Theory?
5.3理論とは何か
I am a very firm believer in the “5.3 Theory” which has been a topic of interest among Bitcoin enthusiasts.
私は、ビットコイン愛好家の間で関心を集めている「5.3理論」を非常に固く信じる者です。
This theory posits that by dividing the percentage gain from the bottom to the top of one market cycle by 5.3, you can predict the percentage gain for the next cycle.
この理論は、ある市場サイクルの下から上までの上昇率を5.3で割ることで、次のサイクルの上昇率を予測できると仮定しています。
This theory has been holding true since the beginning of Bitcoin. In every cycle when the market is in full swing, people are always too optimistic all kinds of crazy theories float around. People said in the last bull run that this cycle is gonna be different, a supercycle or a 100k Bitcoin is eminent and what not. But did any of that actually transpire? Heck NO.
この理論は、ビットコインの始まりから真実であり続けています。市場が本格化するすべてのサイクルで、人々は常に楽観的すぎ、あらゆる種類のクレイジーな理論が浮かんでいます。人々は最後の強気相場で、このサイクルは異なるだろう、スーパーサイクルまたは100k ビットコインは顕著となると言いました。しかし、それは実際に起こったのでしょうか? 否です。
This theory has always held true till now and if it holds this time as well, we are at the foothills of what will be the weakest bull run Bitcoin has ever experienced percentage gain-wise.
この理論はこれまで常に真実であり、今回も当てはまる場合、我々は、ビットコインがこれまでに経験した利得率で最も弱い強気相場の麓にいます。
This is further supported by the fact that we’ve already seen a double top in the market and a breach below the 200-week MA.
これは、すでに市場でダブルトップと200週移動平均線を下回っているという事実によってさらに裏付けられています。
The Cross of Concern: 100-week MA Below the 200-week MA
懸念の十字架:200週移動平均線を下回る100週移動平均線
The recent crossover of the 100-week MA below the 200-week MA has never occurred before in Bitcoin’s history. This could be interpreted as a major red flag. However, it’s essential to consider the broader context.
最近、100週移動平均線が200週移動平均線を下回るクロスオーバーは、ビットコインの歴史の中でこれまでに発生したことはありません。これは重大な危険信号と解釈できます。ただし、より広いコンテキストを考慮することが不可欠です。
In previous cycles, near crossovers acted as precursors to significant bull runs, suggesting that this could be a fake-out rather than a definitive sign of a downturn.
これまでのサイクルでは、クロスオーバーに近い局面が大幅な強気相場の前兆として機能しており、これは景気後退の決定的な兆候というよりは、フェイクアウトである可能性を示唆しています。
=========================
インターネット・コンピュータランキング
=========================
ネットサービスランキング
=========================