今度は後期のレポートをRでやってみたいと思います。
任意の時系列データを分析せよというもので(前期は「回帰分析」指定だったかも)
当時経済政策の授業でやっていたフィリップス曲線の理論を用いることを思いつき、
1978~2012年の分析結果から、2013年のインフレ率を「2%」とした時の完全失業率を
予測するというものをやって提出していました。
ただ、当時のレポートを読むとふざけたことに
「SPSSの時系列分析ツールに含まれる自動モデル作成機能を利用し」
とか書かれています
RではVARモデルでやってみました。
>>>
(1)パッケージのインストール&呼び出し
> install.packages("vars",rep="http://cran.ism.ac.jp")
> library(vars)
(2)データの読み込み
> mydata=read.csv("完全失業率とインフレ率.csv")
> mydata
year shitsugyo inflation
1 1978 2.2 0.043806647
2 1979 2.1 0.036179450
3 1980 2.0 0.078212291
・
・
・
(3)時系列オブジェクトへの変換
> attach(mydata)
> tsdata<-ts(data.frame(shitsugyo,inflation),start=c(1978),frequency=1)
> tsdata
Time Series:
Start = 1978
End = 2012
Frequency = 1
shitsugyo inflation
1978 2.2 0.043806647
1979 2.1 0.036179450
1980 2.0 0.078212291
1981 2.2 0.047927461
1982 2.4 0.028430161
1983 2.6 0.018028846
1984 2.7 0.023612751
1985 2.6 0.019607843
1986 2.8 0.006787330
1987 2.8 0.000000000
1988 2.5 0.007865169
1989 2.3 0.022296544
1990 2.1 0.030534351
1991 2.1 0.032804233
1992 2.2 0.017418033
1993 2.5 0.013091641
1994 2.9 0.005964215
1995 3.2 -0.000988142
1996 3.4 0.000989120
1997 3.4 0.018774704
1998 4.1 0.005819593
1999 4.7 -0.002892960
2000 4.7 -0.006769826
2001 5.0 -0.007789679
2002 5.4 -0.008832188
2003 5.3 -0.002970297
2004 4.7 0.000000000
2005 4.4 -0.002979146
2006 4.1 0.002988048
2007 3.9 0.000000000
2008 4.0 0.013902681
2009 5.1 -0.013712047
2010 5.1 -0.006951341
2011 4.6 -0.003000000
2012 4.3 0.000000000
(4)最適な次数を調べる
> VARselect(tsdata,lag.max=5,type="const")
$selection
AIC(n) HQ(n) SC(n) FPE(n)
2 2 1 2
$criteria
1 2 3 4 5
AIC(n) -1.200239e+01 -1.209382e+01 -1.194445e+01 -1.180444e+01 -1.165958e+01
HQ(n) -1.191274e+01 -1.194441e+01 -1.173526e+01 -1.153548e+01 -1.133086e+01
SC(n) -1.172215e+01 -1.162676e+01 -1.129055e+01 -1.096372e+01 -1.063204e+01
FPE(n) 6.137766e-06 5.629185e-06 6.609971e-06 7.761309e-06 9.276880e-06
(5)VARモデルを推定
> tsdata.var<-VAR(tsdata,p=2,type="const")
> summary(tsdata.var)
VAR Estimation Results:
=========================
Endogenous variables: shitsugyo, inflation
Deterministic variables: const
Sample size: 33
Log Likelihood: 99.394
Roots of the characteristic polynomial:
0.8043 0.6651 0.4963 0.07686
Call:
VAR(y = tsdata, p = 2, type = "const")
Estimation results for equation shitsugyo:
==========================================
shitsugyo = shitsugyo.l1 + inflation.l1 + shitsugyo.l2 + inflation.l2 + const
Estimate Std. Error t value Pr(>|t|)
shitsugyo.l1 1.5011 0.1963 7.648 2.49e-08 ***
inflation.l1 7.9487 5.5850 1.423 0.16572
shitsugyo.l2 -0.5536 0.1960 -2.825 0.00862 **
inflation.l2 -5.5434 5.4354 -1.020 0.31652
const 0.1884 0.3422 0.551 0.58627
---
Signif. codes: 0 ‘***’ 0.001 ‘**’ 0.01 ‘*’ 0.05 ‘.’ 0.1 ‘ ’ 1
Residual standard error: 0.3168 on 28 degrees of freedom
Multiple R-Squared: 0.9301, Adjusted R-squared: 0.9202
F-statistic: 93.2 on 4 and 28 DF, p-value: 9.248e-16
Estimation results for equation inflation:
==========================================
inflation = shitsugyo.l1 + inflation.l1 + shitsugyo.l2 + inflation.l2 + const
Estimate Std. Error t value Pr(>|t|)
shitsugyo.l1 -0.014443 0.007599 -1.901 0.0677 .
inflation.l1 0.387748 0.216227 1.793 0.0837 .
shitsugyo.l2 0.010039 0.007587 1.323 0.1965
inflation.l2 0.137376 0.210434 0.653 0.5192
const 0.020026 0.013250 1.511 0.1419
---
Signif. codes: 0 ‘***’ 0.001 ‘**’ 0.01 ‘*’ 0.05 ‘.’ 0.1 ‘ ’ 1
Residual standard error: 0.01227 on 28 degrees of freedom
Multiple R-Squared: 0.6237, Adjusted R-squared: 0.5699
F-statistic: 11.6 on 4 and 28 DF, p-value: 1.111e-05
Covariance matrix of residuals:
shitsugyo inflation
shitsugyo 0.100373 -0.0018912
inflation -0.001891 0.0001504
Correlation matrix of residuals:
shitsugyo inflation
shitsugyo 1.0000 -0.4867
inflation -0.4867 1.0000
(6)一期先を予測(95%信頼区間)
> predict(tsdata.var,n.ahead=1,ci=0.95,dumvar=NULL)
$shitsugyo
fcst lower upper CI
shitsugyo.fcst 4.112916 3.491968 4.733865 0.6209484
$inflation
fcst lower upper CI
inflation.fcst 0.003688914 -0.02035151 0.02772934 0.02404043
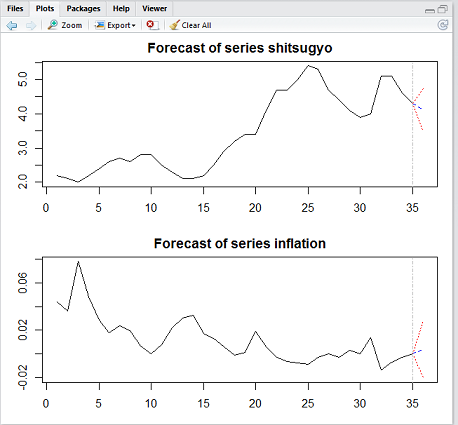
(7)予測結果をプロット
> plot(predict(tsdata.var,n.ahead=1,ci=0.95,dumvar=NULL))

<<<
SPSSの結果と大きくずれてはいないものの一致はしていません。
(予測4.03、上4,59、下3.52)
ネット上のサンプルコード丸写しで取りあえずやってみたけど
明日教科書を読んで咀嚼したいと思います。
任意の時系列データを分析せよというもので(前期は「回帰分析」指定だったかも)
当時経済政策の授業でやっていたフィリップス曲線の理論を用いることを思いつき、
1978~2012年の分析結果から、2013年のインフレ率を「2%」とした時の完全失業率を
予測するというものをやって提出していました。
ただ、当時のレポートを読むとふざけたことに
「SPSSの時系列分析ツールに含まれる自動モデル作成機能を利用し」
とか書かれています
RではVARモデルでやってみました。
>>>
(1)パッケージのインストール&呼び出し
> install.packages("vars",rep="http://cran.ism.ac.jp")
> library(vars)
(2)データの読み込み
> mydata=read.csv("完全失業率とインフレ率.csv")
> mydata
year shitsugyo inflation
1 1978 2.2 0.043806647
2 1979 2.1 0.036179450
3 1980 2.0 0.078212291
・
・
・
(3)時系列オブジェクトへの変換
> attach(mydata)
> tsdata<-ts(data.frame(shitsugyo,inflation),start=c(1978),frequency=1)
> tsdata
Time Series:
Start = 1978
End = 2012
Frequency = 1
shitsugyo inflation
1978 2.2 0.043806647
1979 2.1 0.036179450
1980 2.0 0.078212291
1981 2.2 0.047927461
1982 2.4 0.028430161
1983 2.6 0.018028846
1984 2.7 0.023612751
1985 2.6 0.019607843
1986 2.8 0.006787330
1987 2.8 0.000000000
1988 2.5 0.007865169
1989 2.3 0.022296544
1990 2.1 0.030534351
1991 2.1 0.032804233
1992 2.2 0.017418033
1993 2.5 0.013091641
1994 2.9 0.005964215
1995 3.2 -0.000988142
1996 3.4 0.000989120
1997 3.4 0.018774704
1998 4.1 0.005819593
1999 4.7 -0.002892960
2000 4.7 -0.006769826
2001 5.0 -0.007789679
2002 5.4 -0.008832188
2003 5.3 -0.002970297
2004 4.7 0.000000000
2005 4.4 -0.002979146
2006 4.1 0.002988048
2007 3.9 0.000000000
2008 4.0 0.013902681
2009 5.1 -0.013712047
2010 5.1 -0.006951341
2011 4.6 -0.003000000
2012 4.3 0.000000000
(4)最適な次数を調べる
> VARselect(tsdata,lag.max=5,type="const")
$selection
AIC(n) HQ(n) SC(n) FPE(n)
2 2 1 2
$criteria
1 2 3 4 5
AIC(n) -1.200239e+01 -1.209382e+01 -1.194445e+01 -1.180444e+01 -1.165958e+01
HQ(n) -1.191274e+01 -1.194441e+01 -1.173526e+01 -1.153548e+01 -1.133086e+01
SC(n) -1.172215e+01 -1.162676e+01 -1.129055e+01 -1.096372e+01 -1.063204e+01
FPE(n) 6.137766e-06 5.629185e-06 6.609971e-06 7.761309e-06 9.276880e-06
(5)VARモデルを推定
> tsdata.var<-VAR(tsdata,p=2,type="const")
> summary(tsdata.var)
VAR Estimation Results:
=========================
Endogenous variables: shitsugyo, inflation
Deterministic variables: const
Sample size: 33
Log Likelihood: 99.394
Roots of the characteristic polynomial:
0.8043 0.6651 0.4963 0.07686
Call:
VAR(y = tsdata, p = 2, type = "const")
Estimation results for equation shitsugyo:
==========================================
shitsugyo = shitsugyo.l1 + inflation.l1 + shitsugyo.l2 + inflation.l2 + const
Estimate Std. Error t value Pr(>|t|)
shitsugyo.l1 1.5011 0.1963 7.648 2.49e-08 ***
inflation.l1 7.9487 5.5850 1.423 0.16572
shitsugyo.l2 -0.5536 0.1960 -2.825 0.00862 **
inflation.l2 -5.5434 5.4354 -1.020 0.31652
const 0.1884 0.3422 0.551 0.58627
---
Signif. codes: 0 ‘***’ 0.001 ‘**’ 0.01 ‘*’ 0.05 ‘.’ 0.1 ‘ ’ 1
Residual standard error: 0.3168 on 28 degrees of freedom
Multiple R-Squared: 0.9301, Adjusted R-squared: 0.9202
F-statistic: 93.2 on 4 and 28 DF, p-value: 9.248e-16
Estimation results for equation inflation:
==========================================
inflation = shitsugyo.l1 + inflation.l1 + shitsugyo.l2 + inflation.l2 + const
Estimate Std. Error t value Pr(>|t|)
shitsugyo.l1 -0.014443 0.007599 -1.901 0.0677 .
inflation.l1 0.387748 0.216227 1.793 0.0837 .
shitsugyo.l2 0.010039 0.007587 1.323 0.1965
inflation.l2 0.137376 0.210434 0.653 0.5192
const 0.020026 0.013250 1.511 0.1419
---
Signif. codes: 0 ‘***’ 0.001 ‘**’ 0.01 ‘*’ 0.05 ‘.’ 0.1 ‘ ’ 1
Residual standard error: 0.01227 on 28 degrees of freedom
Multiple R-Squared: 0.6237, Adjusted R-squared: 0.5699
F-statistic: 11.6 on 4 and 28 DF, p-value: 1.111e-05
Covariance matrix of residuals:
shitsugyo inflation
shitsugyo 0.100373 -0.0018912
inflation -0.001891 0.0001504
Correlation matrix of residuals:
shitsugyo inflation
shitsugyo 1.0000 -0.4867
inflation -0.4867 1.0000
(6)一期先を予測(95%信頼区間)
> predict(tsdata.var,n.ahead=1,ci=0.95,dumvar=NULL)
$shitsugyo
fcst lower upper CI
shitsugyo.fcst 4.112916 3.491968 4.733865 0.6209484
$inflation
fcst lower upper CI
inflation.fcst 0.003688914 -0.02035151 0.02772934 0.02404043
(7)予測結果をプロット
> plot(predict(tsdata.var,n.ahead=1,ci=0.95,dumvar=NULL))
<<<
SPSSの結果と大きくずれてはいないものの一致はしていません。
(予測4.03、上4,59、下3.52)
ネット上のサンプルコード丸写しで取りあえずやってみたけど
明日教科書を読んで咀嚼したいと思います。